As we approach the midweek session of a holiday shortened week, there is plenty for the markets to bite into. Again Brexit is remaining at the top or close to the top of trader’s minds. The UK and the EU are still attempting to find a breakthrough in their negotiation with considerable progress already made in recent weeks. However the fishing issue remains a major obstacle, with talks expected to run beyond Christmas. The market sold off at the beginning of the week on a combination of a failure to reach agreement before the Sunday deadline expired, but also on the announcement that the UK had found a new more transmissible strain of the covid-19 virus. The new strain has not been reported to make people any sicker but it is said to be spreading at a much faster rate. Countries began to ban travel from the UK shortly after the British Government moved London and the South East of England to Tier 4 restrictions at the weekend. Markets sold risk at the open on Sunday/Monday as a trade between the UK and Europe ground to a halt. At the time of writing trade has still to resume and the UK and France are coordination to open the cross channel travel sometime on Wednesday. However a different headline was driving sentiment in the US, where democrats and republicans reached an agreement for a $900Bn stimulus deal. This was announced on Monday and lead to a bid in risk coming back into markets in the US session. Thus there has essentially been a mid-Atlantic split with risk off in Europe and risk on in America. On Wednesday much of the data that is normally released on a Thursday and Friday will be released early due to the holiday shortened week.
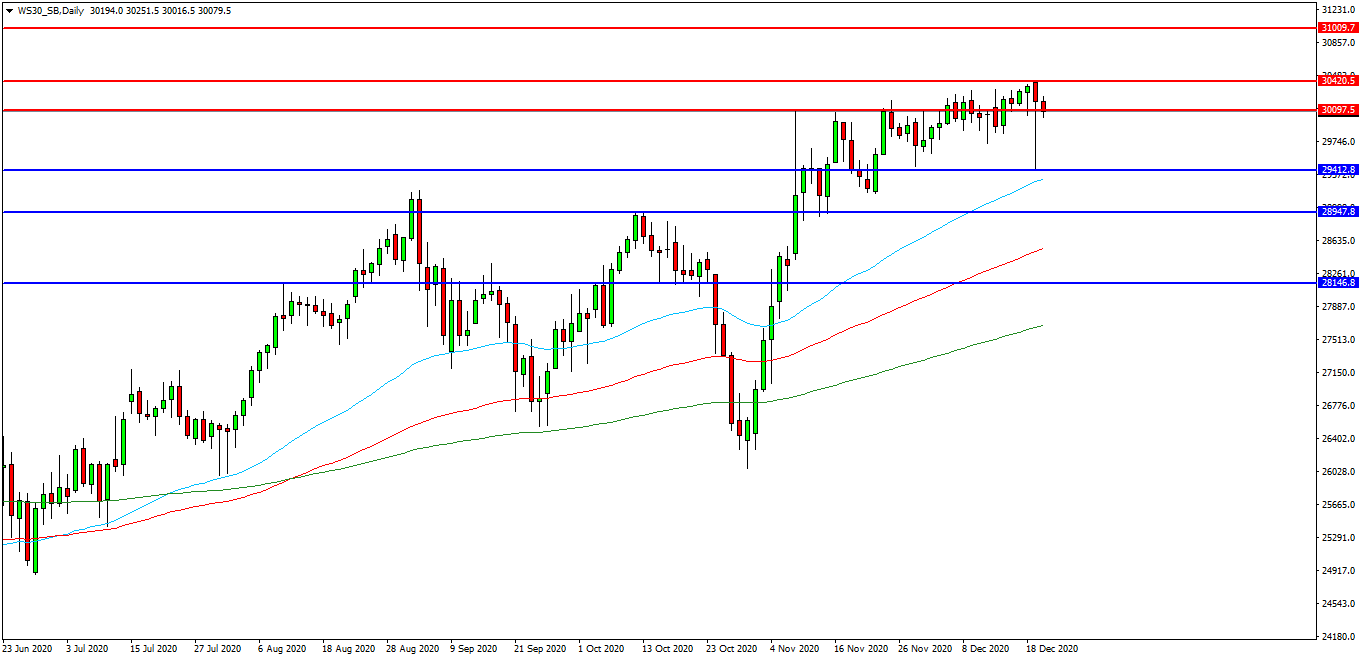
Wall Street 30 Index
The Wall St 30 Index is continuing its move higher since the US Presidential election in early November. Price action is supported by the rising moving averages in particular the 50 EDMA at 29320.00. A break above yesterday’s high of 30425.00 will be seen as encouragement for buyers with a continuation of the move higher. Resistance may be seen at 30100.00 followed by the 30400.00 area. These levels provide the initial upside resistance. A confirmed breakout above 30500.00 would appear bullish and target further resistances at 30750.00 and the 31000.00 area. Alternatively, a move back below 29400.00 may signal a test on support at 29000.00 followed by the October high at 28950.00. The 28145.00 area may also provide support.
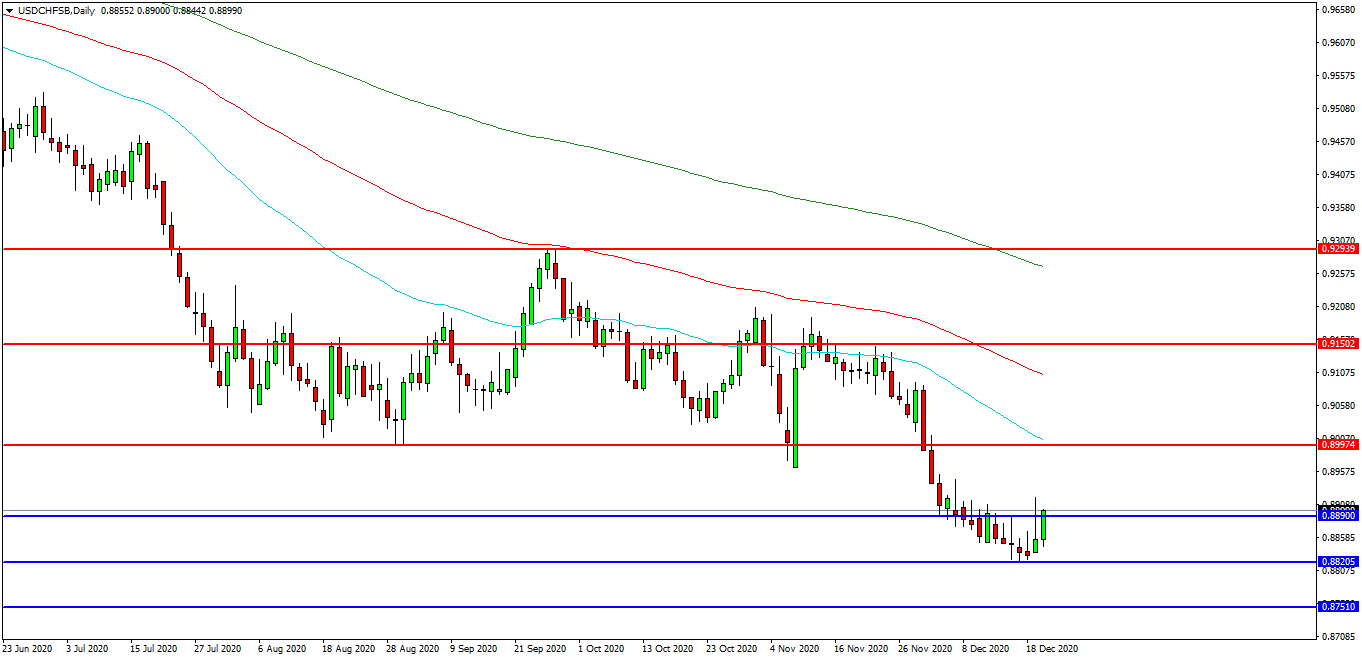
USDCHF
The USDCHF chart is trending lower with a low set at 0.8820 Support was found at that level and price is now testing 0.8890 as support. Further support may be seen acting on price below 0.8800 at 0.8750. The price attempted to break higher but found resistance at the 0.8918 area. Price may use resistance at 0.9000 and the 50 EDMA. A breakout higher may seek to test the 0.9105 area followed by the lower high at 0.9150. Above these levels the 200 EDMA around the 0.9268 area is followed by 0.9294/0.9300.
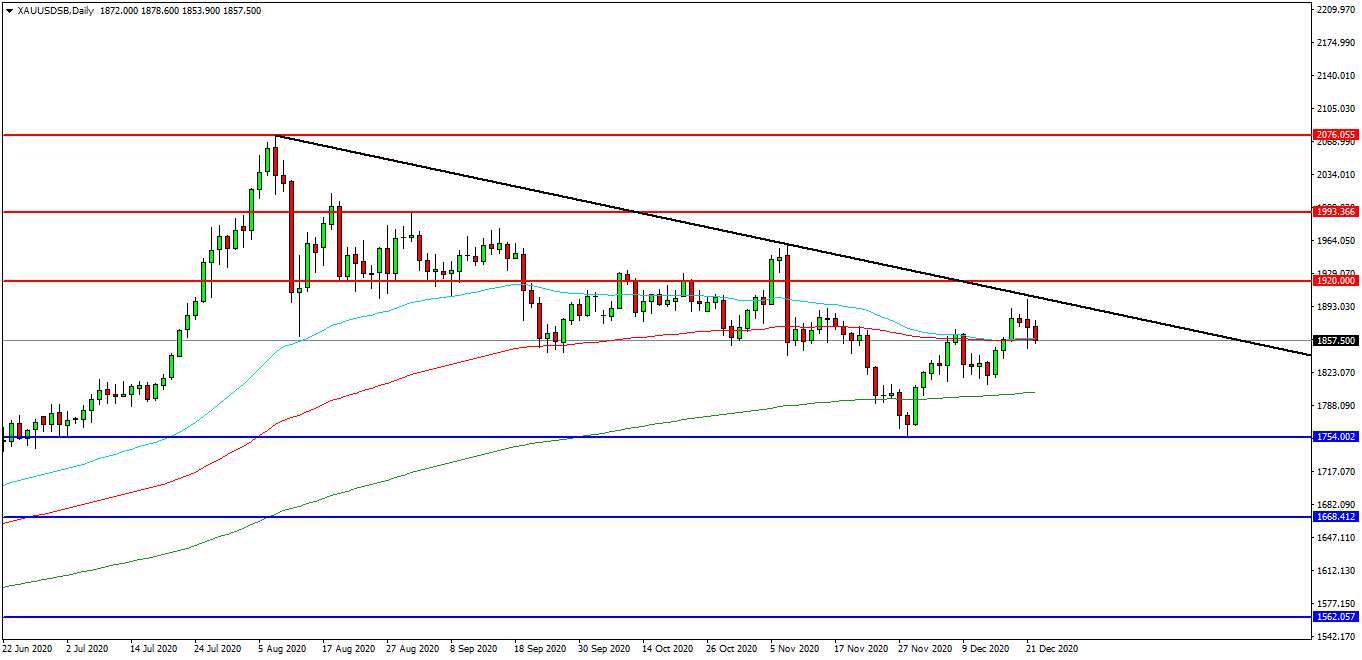
Gold
The Gold chart is trending lower after breaking higher to retest the falling trend line yesterday at the 1904.00 level. The pair has found resistance at 1902.00 and has tested support at 1850.00. A confirmed breakout above this range may open the way to initial resistance at 1920. 00 followed by the 1950.00 area. A continued move higher may find more resistance around the 2000.00 area and 2076.00. Alternatively a move back down under 1845.00 may find initial support at 1800.00. A loss of this level might hand control to sellers and possibly open the way to 1754.00, followed by the 1668.00 level. Below these levels the 1560.00 area may once again play its part as support.