3Sigma Markets – Mid Week Macro Report 18 August 2021
Markets are continuing to focus on the FED with each public engagement becoming a potential risk. Yesterday the FED Chair said that the FED was in the process of putting away its emergency tools used during the Covid crisis but held short of mentioning a taper. The equity markets in the US had been moving lower ahead of his speech but recovered when it was clear that he did not mention tapering. Today the focus will shift to the FOMC Meeting Minutes with traders shifting through the text to see if they can determine a tapering date. Rate hikes are still a long way off and the FED appears to be concerned with the approximately 7 million workers that have not yet returned to work. However, the rise of inflation is pressuring the FED into starting the tapering process, with an announcement September likely.
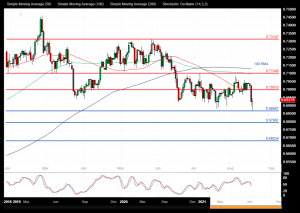
NZDUSD
The NZDUSD FX pair is trading at 0.6927. Price is above its supporting 0.6870 area. Price tested resistance at the 0.7100 level in July creating a lower area of resistance and then sold off. The pair is consolidating since then with a downward bias. Price is using the 0.7000 area as resistance in the short term. A confirmed breakout above 0.7000 and the 50 SMA opens the way to resistance at the 0.7100/0.7130 area and the 100 SMA. The 0.7220 area provides a target along the way to the 0.7315 area. Alternatively a move back down under 0.6870 and the 0.6900 zone open the way to support at 0.6800. The 0.6795 area support is followed by further supports at 0.6700 and 0.6683.
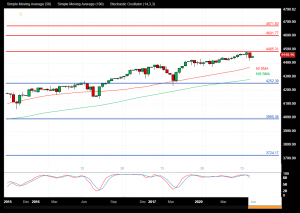
US 500 Index
The US 500 Index created a new high at 4485.00 on Monday and is now testing the 4450.00 area as resistance as price action remain bullish. If the market breaks above the resistance area, the way opens to 4500.00. The market backed off from the high yesterday and found support at the 4417.00 area. Price is attempting to build on support in this area followed by the 4400.00 area. A move higher from the current level, targets resistances at the 4600.00 area and 4672.00 level. Beyond this level, 4700.00 offers resistance as the extreme target. Alternatively, a move back below 4400.00 signals a test on the support at 50 SMA around 4368.00 The 4300.00 then becomes supportive followed by the 100 SMA around 4277.00. Below this level the 4250.00 area would be used as support along with the 4200.00 level. A run below this support would quickly target the 4060.00 followed by 4000.00/3990.00.
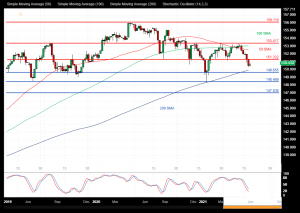
GBPJPY
The GBPJPY chart is showing how the pair has traded lower over recent days with price now trading at 150.655. The 151.332 level is expected to act as resistance in the short term. A break above this level would find resistance at the 50 SMA around 152.600 which has crossed below the 100SMA currently around 153.000 level. A continued move higher may find more resistance around the 153.400 level with a breakout leading to a targeting of the 156.116 area. Alternatively a move back down under 150.000 and the 200 SMA, would find supports at 149.655 and 148.470 as last month’s low. A loss of this level extends the control of sellers and opens the way to a test on 147.000.