3Sigma Markets – Mid Week Macro Report 14 July 2021
US Equity Markets fell yesterday after the 30-Year Treasury Bond auction and the higher than expected CPI data release. The CPI data increased to 0.9% against a forecast of 0.5% and a 0.6% read from last month. Core CPI increased to 0.9% from a forecast of 0.4% and a read last month of 0.7%. The 30-Year sold at 2.00/2.2 from 2.17/2.3 at the last auction. Equity markets sold off after the US CPI data release but recovery and reached new all-time highs, albeit briefly, before settling marginally lower on the close following the 30-Year Auction . The Dollar also had a positive day yesterday following the stronger than expected inflation figure out of the US. This was particularly evident against the lower yielding currencies in the G10 space, these are also known as the ‘’funders’’ – EUR, JPY and CHF. The move in FX was most pronounced in EUR/USD – however we feel yesterday’s events were significant and we should see further strength in the Dollar over coming sessions. If the market is to properly sit up and take note of this stronger inflation figure and we are to see that filter through into the US Fixed Income markets, we need to play close attention to the stock markets, which, as mentioned earlier are now trading at elevated levels. Earnings season has kicked off this week, with some of the large financials reporting – we saw stellar earnings from Goldman Sachs and JP Morgan yesterday. Yet another strong earnings season will further support the equity markets. The Oil market is also signalling increasing prices with WTI up to $75.00 again, recovering well from sell off post OPEC+ meeting last week. Markets will be focussed on FED Chair Powell this afternoon as he testifies on the Semi-Annual Monetary Policy Report before the House Financial Services Committee, in Washington DC. Any talk of tapering may signal weakness in asset prices and following yesterday’s inflation figure, he should be further pushed on the transitory nature of inflation going forward. We also get the Bank of Canada rate decision and Monetary policy report today.
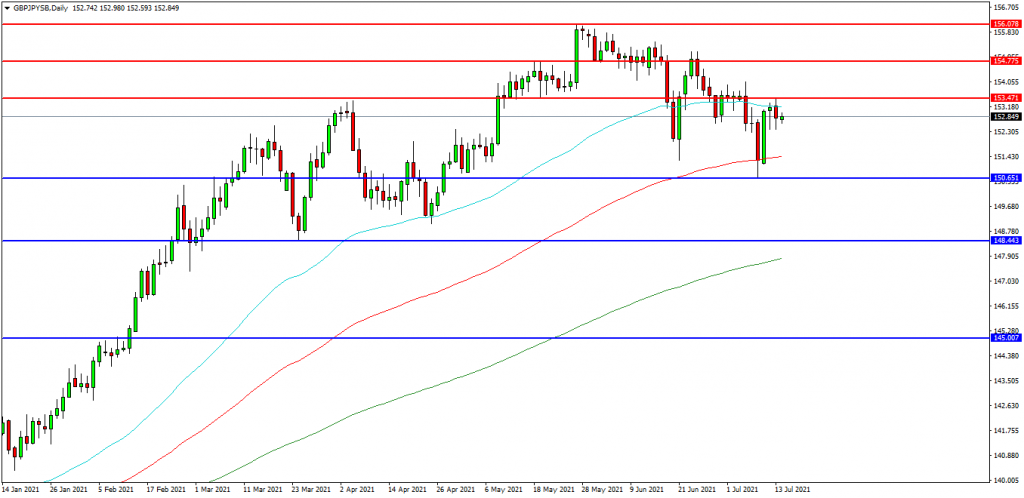
GBPJPY
The GBPJPY FX pair is trading at 152.820. Price is above its supporting 152.500 area. Price tested resistance at the 156.000 level in May and created a new high. The pair is now trading down since then and seeking support. Price is using the 153.500 area as resistance. A confirmed breakout above 153.1470 may open the way to resistance at the 154.000 area. The 154.775 area may provide a target along the way to the 156.000 area. Alternatively a move back down under 152.500 and the 152.000 zone may find initial support at 151.430 and the 100 day moving average. The 150.000 area may be used as support followed by further supports at 149.200 and 148.440.
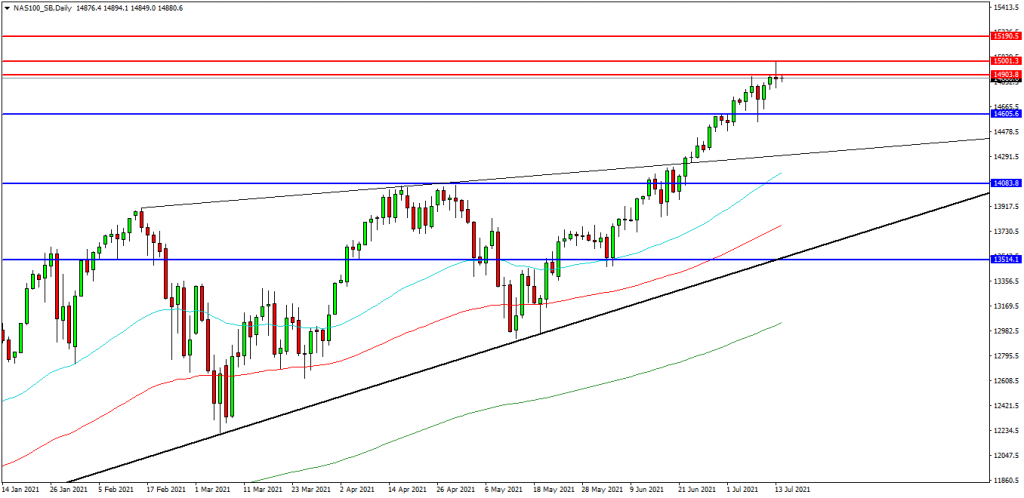
Nasdaq 100 Index
The Nasdaq 100 Index created a new high at 15000.00 yesterday and is now testing the 14877.00 area as resistance. If the market breaks above this area, a test on the 15000.00 round number could be possible once again. The market rallied from support over the last number of days and has potentially reached its resistance area. Price is attempting to build on support at 14600.00 followed by the 14500.00/14480.00 area as support. A move higher from the current level may target resistances at the 14900.00 area and 15000.00. Beyond this level, 15100.00 may offer resistance followed by the 15190.00 level. Alternatively, a move back below 14600.00 may signal a test on the support at 14350.00. Below this level the 14080.00 area may be used as support along with the 14000.00 level. A run below this support may quickly target the 13600.00 followed by 13500.00.
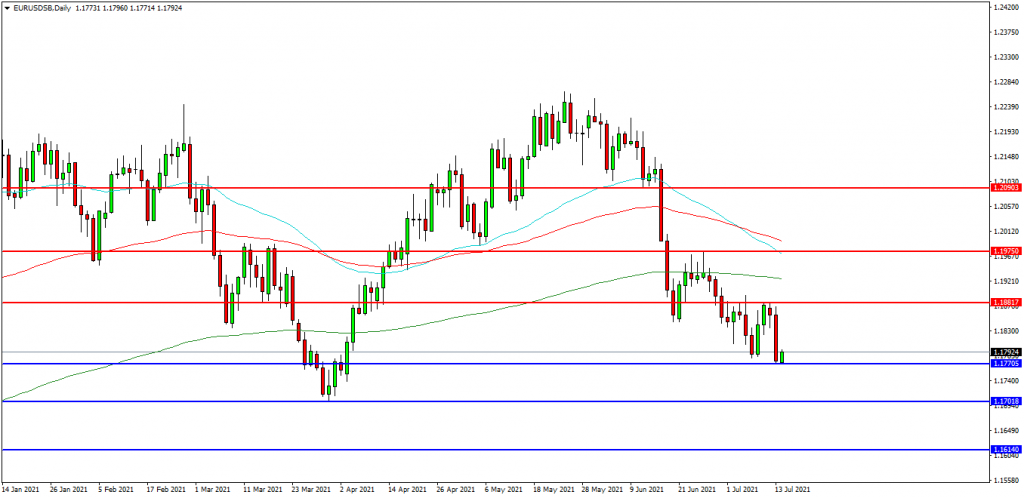
EURUSD
The EURUSD chart is showing how the pair has traded lower over recent days and is now trading at 1.1792. The 1.1800 level is expected to act as resistance and the 1.1700 area is the initial support area. The pair may find resistance at the 1.1815 area and the 1.1850 level on a break higher. A continued move higher may find more resistance around the 1.1880 level followed by the 1.1975 area. Alternatively a move back down under 1.1770 may find supports between 1.1700 and 1.1680. A loss of this level may extend the control of sellers and possibly open the way to a test on 1.1640. Below this level the 1.1600 area may play its part as support as well as the 1.1550 area.