3Sigma Markets – Mid Week Macro Report May 26th 2021
The markets have recovered back to all time highs in equity indices. The markets are consolidating at a high level in an attempt to breakout to new all time highs and push above the current area of consolidation. However there is substantial resistance to overcome before this is achieved. This consolidation has allowed lagging indicators time to catch up and it has alleviated overbought conditions on indicators, essentially giving the market room to move higher or at least justify a technical move higher. There are still concerns around the globe from the Covid-19 pandemic but the market has looked through and ignored these for quite some time now. This does not mean that the pandemic will have longer last consequences. The rising price of various goods has been a major economic hurdle for consumers with evidence emerging that sales are declining as consumers turn away from some of the affected items. The main issue with this type of inflation is that it stems from supply and demand issues, but there will be a resolution to the supply problem once production and transport is fully restored – this is the principle thesis of the US Fed, who argue through their chairman Powell that a spike in inflation over the coming months is simply transitory.
With the demand side of the equation, the fact that consumers are withholding purchases, may cap prices for a time. There is also volatility in markets due to the selling in crypto currencies of late – Musk tweets, China crack down, environmental concerns and the usual regulatory woes. The fall in crypto prices has resulted in leveraged positions having to cut positions elsewhere with volatility emerging in asset classes such as stocks and FX. One beneficiary of this volatility is gold which has seen it break resistance and head over 1900.00 – trading to a high of $1,910.27 this morning. Gold and Crypto have been fighting for some of the same space as alternative investments in recent years with Gold having suffered badly as a result. There is now some optimism amongst buyers that it may retest its all time highs and benefit from the volatility.
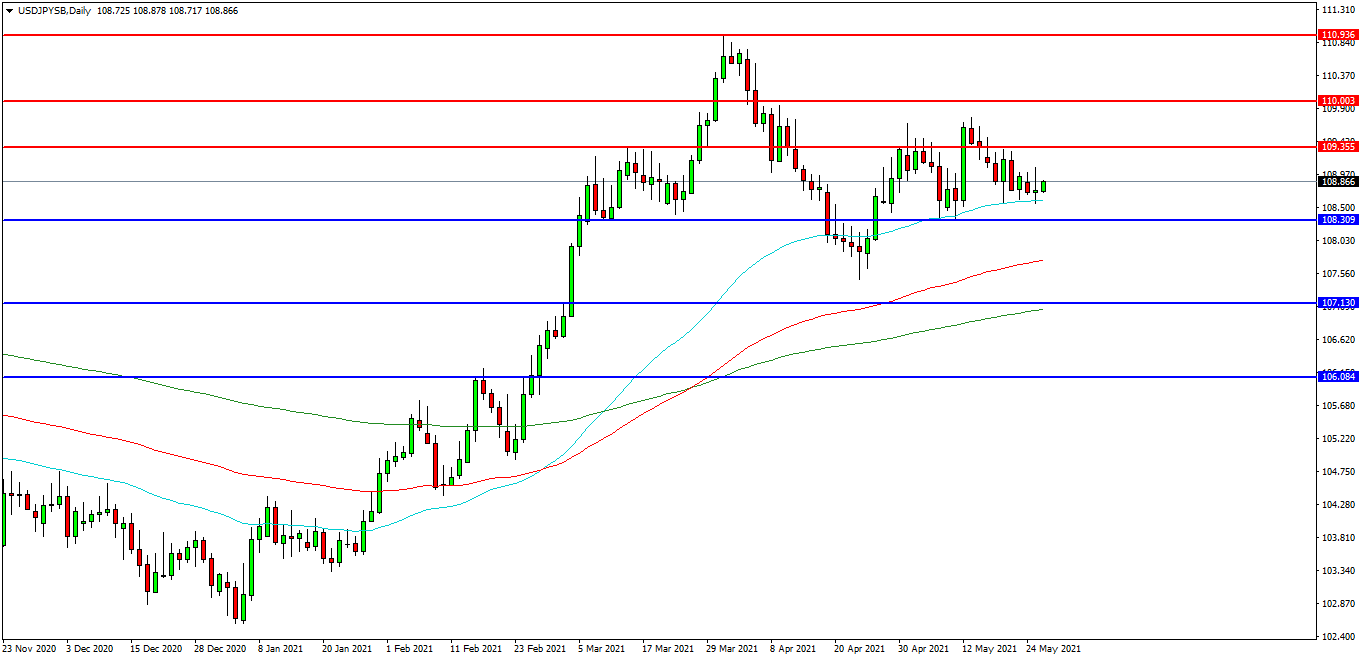
USDJYP
The USDJPY FX pair is consolidating above its 50 EDMA at 108.600. Price tested support at the 50 EDMA and has been surfing the moving average in recent weeks. The pair is now trading at 108.865. Price is using the 108.850 area as support. A confirmed breakout above 109.000 may open the way to initial resistance at the 109.355 area. The 110.000 previous support area may provide a target along the way to the 110.935 area. Alternatively a move back down under the 108.500 zone may find initial support at 108.300. The 108.000 area may be used as support followed by further supports at 107.500 and 107.130.
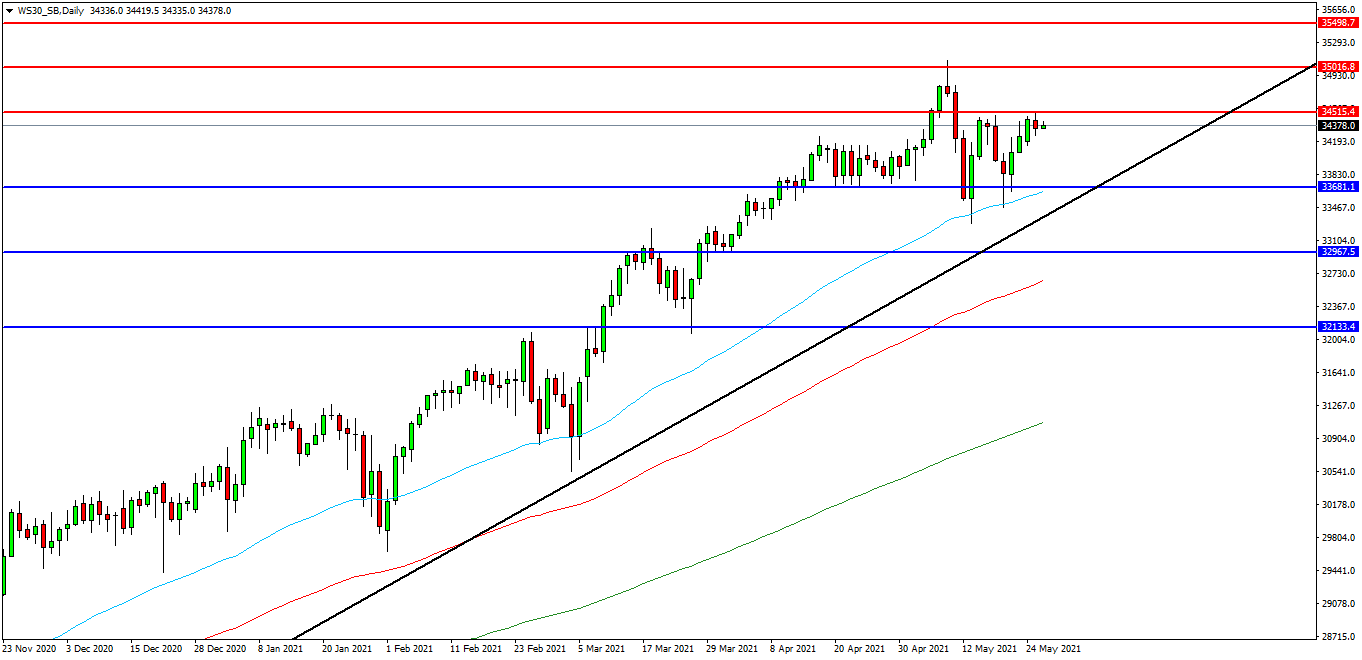
WALL ST 30 INDEX
The Wall St 30 Index created a high at 35090.00 earlier this month and is now testing the area that traders are seeking to break as resistance at 34515.00. If the market fails to get back to this level, it may result in another move down to test the 50EDMA around 33680.00. The market sold off from resistance yesterday but found support on the 34270.00 overnight. Price is attempting to build on this support and at present 34000.00 looks like a potential area followed by the 33800.00 level as support. A move higher from the current level may target resistances at the 34600.00 area and 35000.00. Beyond this level, 35250.00 may offer resistance followed by the 35000.00 level. Alternatively, a move back below 34000.00 may signal a test on the support at 33680.00. Below this level the 33600.00 area may be used as support along with 50EDMA and the 33500.00 level. A run below this support may quickly target the 33300.00 followed by 33000.00.
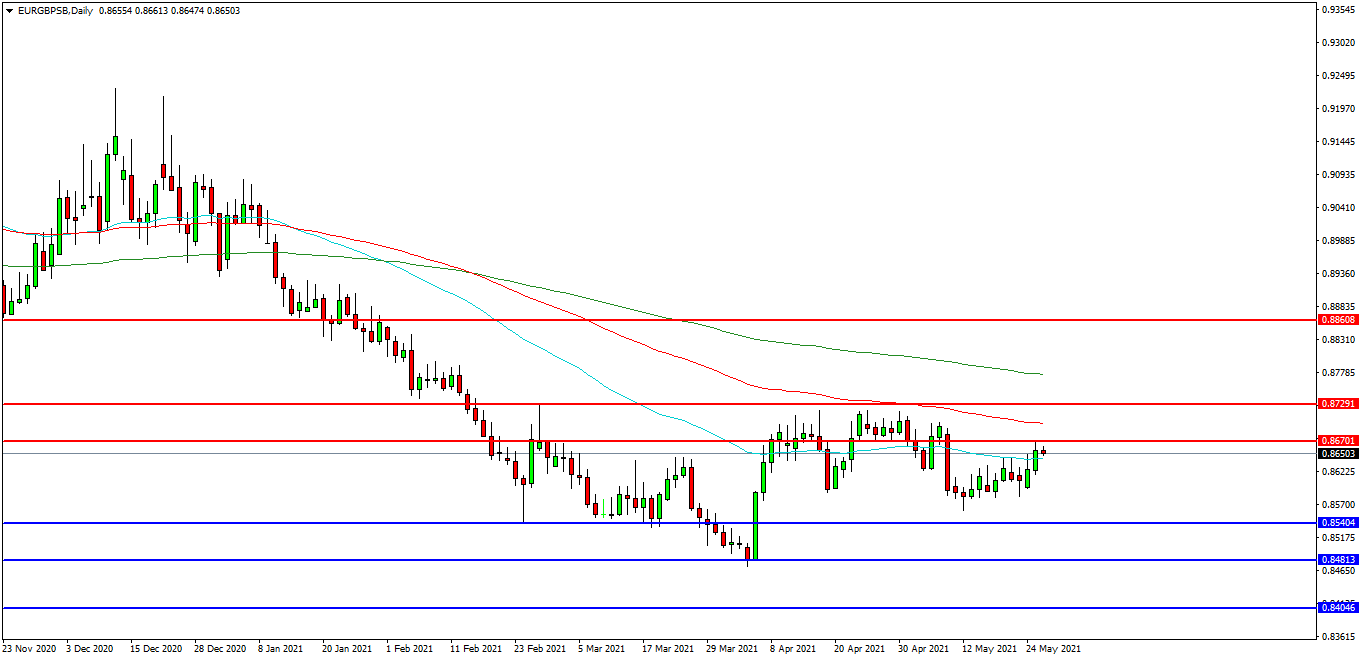
EURGBP
The EURGBP chart is showing how the pair has consolidated around its 50 EDMA over recent weeks and is now trading at 0.8650 and testing the 50 EDMA. The 0.8670 level is expected to act as resistance and 0.8600 area is the initial support area. The pair may find resistance at the 0.8700 area and the 100 EDMA on a break higher. A continued move higher may find more resistance around the 0.8730 level followed by the 0.8780 area. Alternatively a move back down under 0.8590 may find supports between 0.8570 and 0.8540. A loss of this level may extend the control of sellers and possibly open the way to a test on 0.8500. Below this level the 0.8480 area may play its part as support ultimately followed by 0.8400.