3Sigma Markets – Mid Week Macro Report May 19th 2021
The equity indices sold off over the last two days once again as volatility reigns supreme. The selloff is linked to a fall in crypto-currencies with Bitcoin falling under the $44,000 level on its way to test $40,000 – which we have dipped under this morning – forming a triple intra-day bottom that is acting as support for the time being just ahead of $39,000. The initial decline is of course linked to a twitter battle involving Tesla boss Elon Musk after the rejected the crypto as a form of payment for his cars. This has become an environmental issue surrounding the energy intensive mining process of the crypto. This spat could not have come at a worse time for the crypto space, as it coincided with the personal tax payments deadline in the US on 17th May – these tax payment obligations would have forced many investors to free up some capital in order to make the payment – liquidating some of the markets favoured positions – cryptos and tech stocks. This is evident in the performance of both over the past week.
The markets are churning close to all time highs as traders are forced to take profit in order to square positions/accounts and limit risk. Leverage remains at all time highs and this is potentially a recipe for more volatility ahead across a range of markets. There have been little in the way of developments on the economic front apart from the inflation reading ticking higher alongside evidence of higher prices and rising wages in the US. The US FED has committed to its thesis that this rising inflation will be transitory and that overall inflation will move up to the 2% to 2.5% heading into 2022. However a more rapid rise in inflation would give the FED cause for concern and this may lead to them having to taper sooner than anticipated. There are elements within the markets that think the FED is making a mistake and backing itself into a corner. FED Member Clarida said on Monday that he expected inflation to rise due to transitory factors and so the FED would not act in such an event. However he added that he would instead focus on the employment data as his metric for deciding when to take action on tapering. The FED is as such classifying inflation data as noise due to the reopening and that the data is essentially distorted by the response to Covid. The unique dynamics of the current economy are triggering a wait and see response in the FED as they attempt to wait out the distorted data. However this may lead to them being far behind the curve when it comes to taking action on inflation, potentially creating a dangerous outcome for the economy.
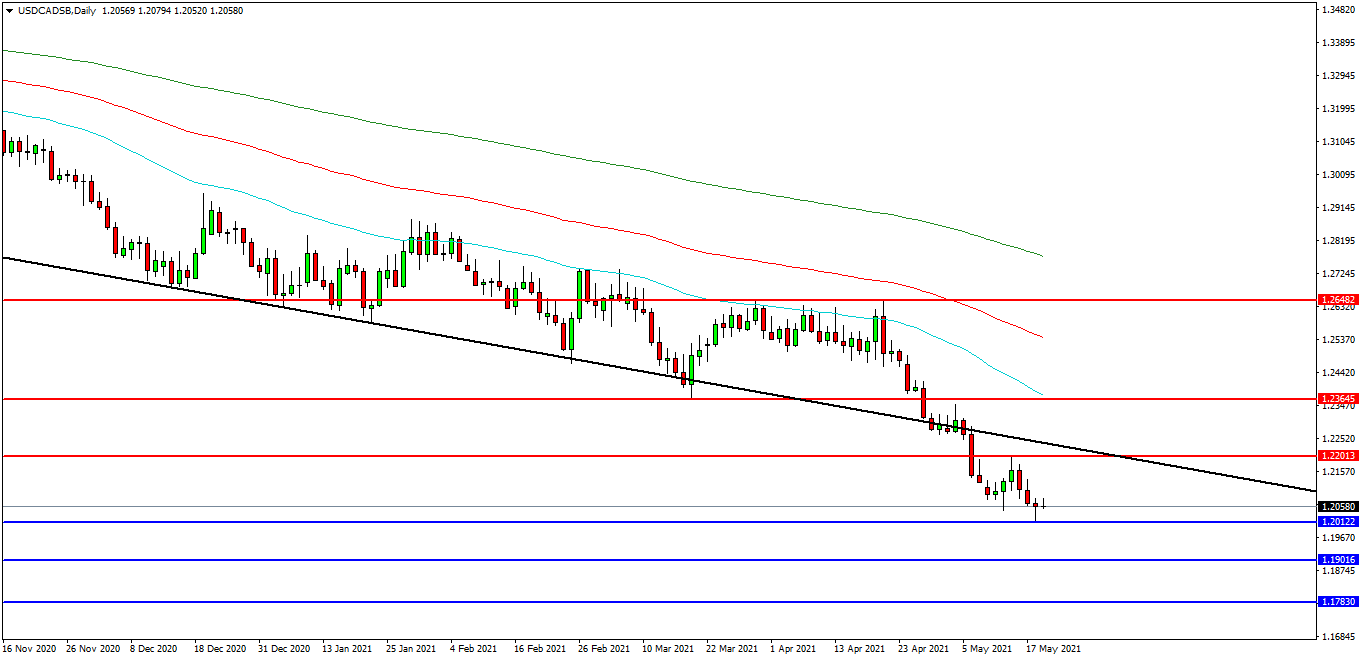
USDCAD
The USDCAD FX pair is moving lower after it lost support last month at 1.2500. Price tested support at the 50 EDMA and rejected sending the pair lower. The pair is now trading at 1.2058. Price is using the 1.2000 area as support. A confirmed breakout above the trend line at 1.2236 may open the way to initial resistance at the 1.2364 area. The 1.2500 previous support area may provide a target along the way to the 1.2648 area. Alternatively a move back down under the 1.2000 zone may find initial support at 1.1950. The 1.1900 area may be used as support followed by further supports at 1.1835 and 1.1783.
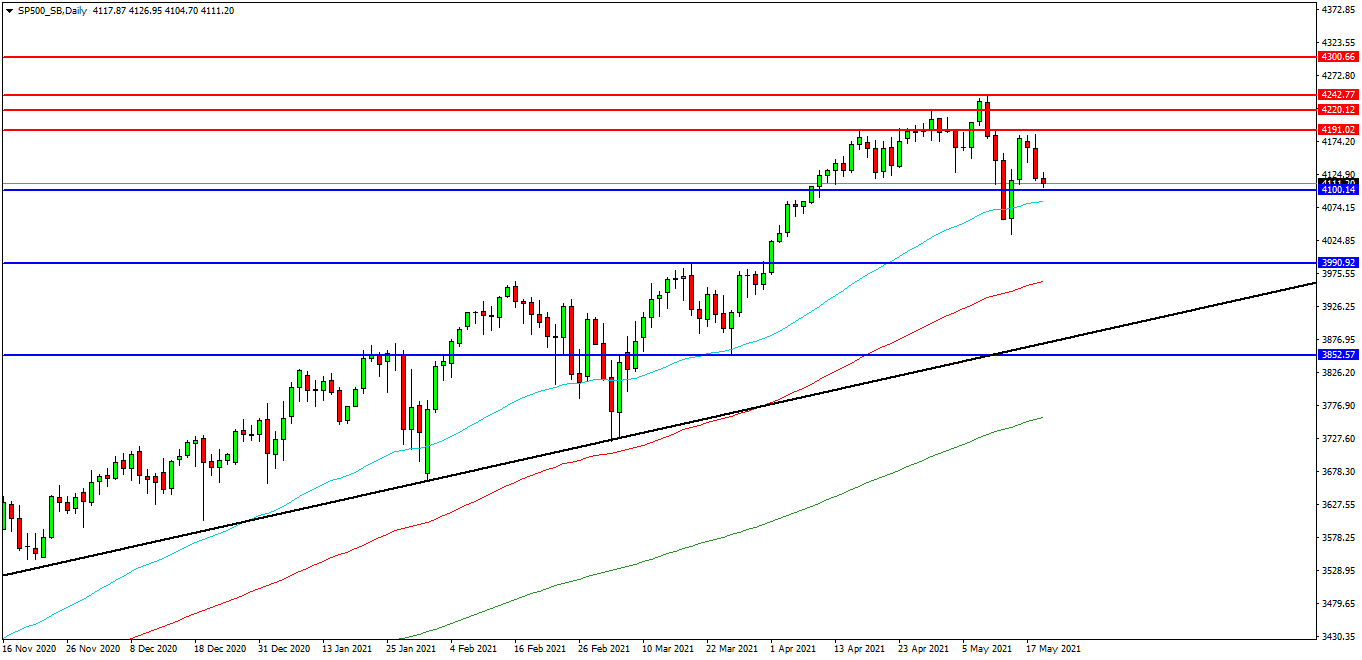
SP 500 INDEX
The SP 500 Index created a high at 4244.00 on Monday last week and is now rejecting the area that traders are seeking to break. If the market fails to get back to this level, it may act as resistance. The market sold off yesterday but found support on the 4100.00 overnight. Price pulled back to the 4100.00 area and found support. Price is attempting to build on this support and at present 4120.00 looks like a potential area followed by the 4140.00 level as resistances. A move higher from the current level may target resistances at the 4190.00 area and 4200.00. Beyond this level, 4220.00 may offer resistance followed by the 4244.00 level. Alternatively, a move back below 4100.00 may signal a test on the support at 4070.00. Below this level the 4050.00 area may be used as support along with 50EDMA and the 4030.00 level. A run below this support may quickly target the 4000.00 followed by 3960.00.
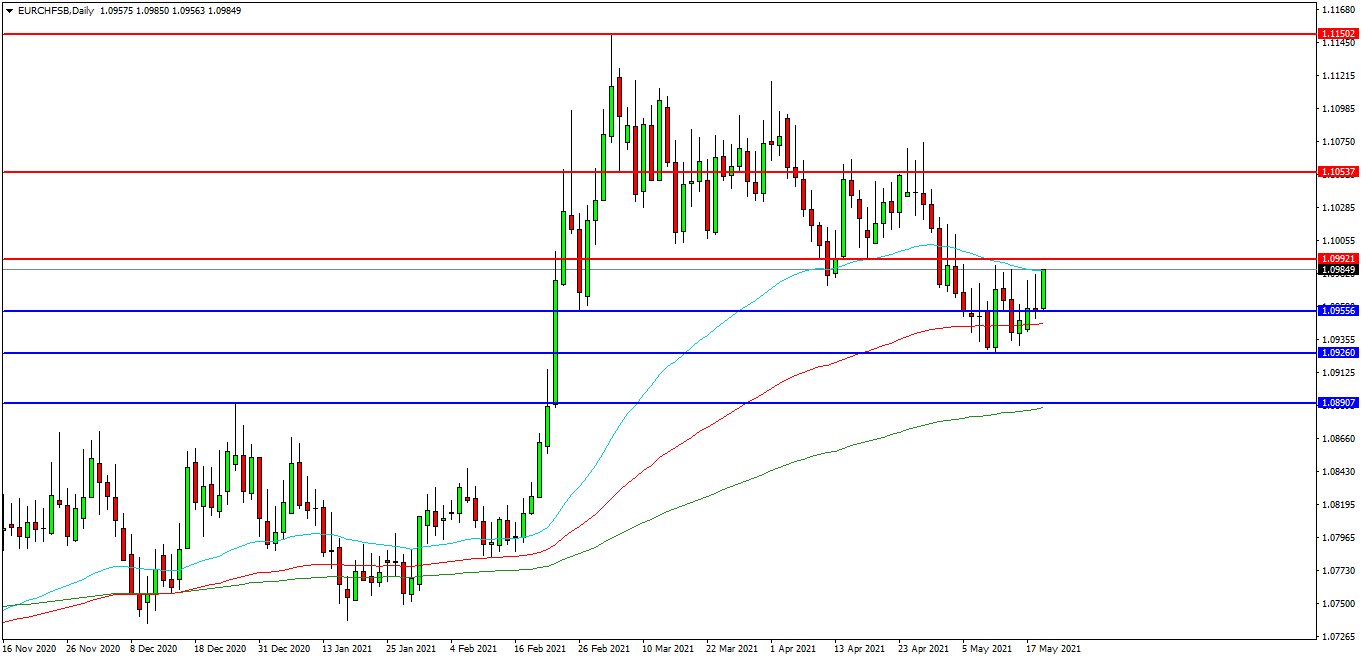
EURCHF
The EURCHF chart is showing how the pair has moved lower over recent weeks and is now trading at 1.0985 and testing resistance at the 50 EDMA. The 1.0990 level is expected to act as resistance and 1.0955 area is the initial support area. The pair may find resistance at the 1.1000 area on a break higher. A continued move higher may find more resistance around the 1.1050 level followed by the 1.1075 area. Alternatively a move back down under 1.0950 may find supports between 1.9040 and 1.0926. A loss of this level may extend the control of sellers and possibly open the way to a test on 1.0900. Below this level the 1.0890 area may play its part as support ultimately followed by 1.0870.