3Sigma Markets – Mid Week Macro Report May 5th 2021
The equity indices sold off over the last two days as market participants took profits following the lower than expected US Non-Farm Payrolls report. The report showed that 266K jobs came online against a forecast of 990K and a previous read of 916K which was revised down to 770K. The Unemployment Rate increased to 6.1%, rising above the expected 5.8% and the previous 6.0%. Average Hourly Earnings increased to 0.7% beating the forecast of 0.0% and the prior read of -0.1%. There are reports of businesses being unable to find workers to take low paid jobs in the US as the pandemic unemployment handout pays more than the workers would receive in wages from working. This is creating pressure on the jobs market, the economy and the government. There are calls for the government to end the payments or reduce the amount handed out. There are also calls for businesses to increase wages and this is part of the increase in the average hourly earnings data, along with higher paid workers returning to work. Yesterday’s Jolts Job openings seemed to confirm the reports with the highest ever recorded reading on the metric coming in at 8.12M jobs. Labour markets conditions are beginning to create wage inflation and this in feeding into the overall inflation outlook. The FED is still of the opinion that this will be transitory but there has also been high levels of fuel and gasoline inflation this week after the Colonial pipeline hack. Asset prices remain on the back foot at present and traders are concerned that this may lead to lower prices in stock markets despite accommodative monetary policy. Cyclical factors are at play here too with equities markets and we also have the added kicker personal tax bills in the US due around 17th May. As we know, retail traders have played a huge part in the equity bull run, but many will be facing tax bills on their yearly profits over the coming week and this may lead to further selling pressure on US equity indices – something to keep on the radars over the coming trading sessions. Tensions are also rising in the Middle East as violence escalates between Palestine and Israel. Traders will be focussed on today’s US CPI reading which is expected to fall to 0.2% from 0.6%, while Core CPI is expected to remain at 03%.
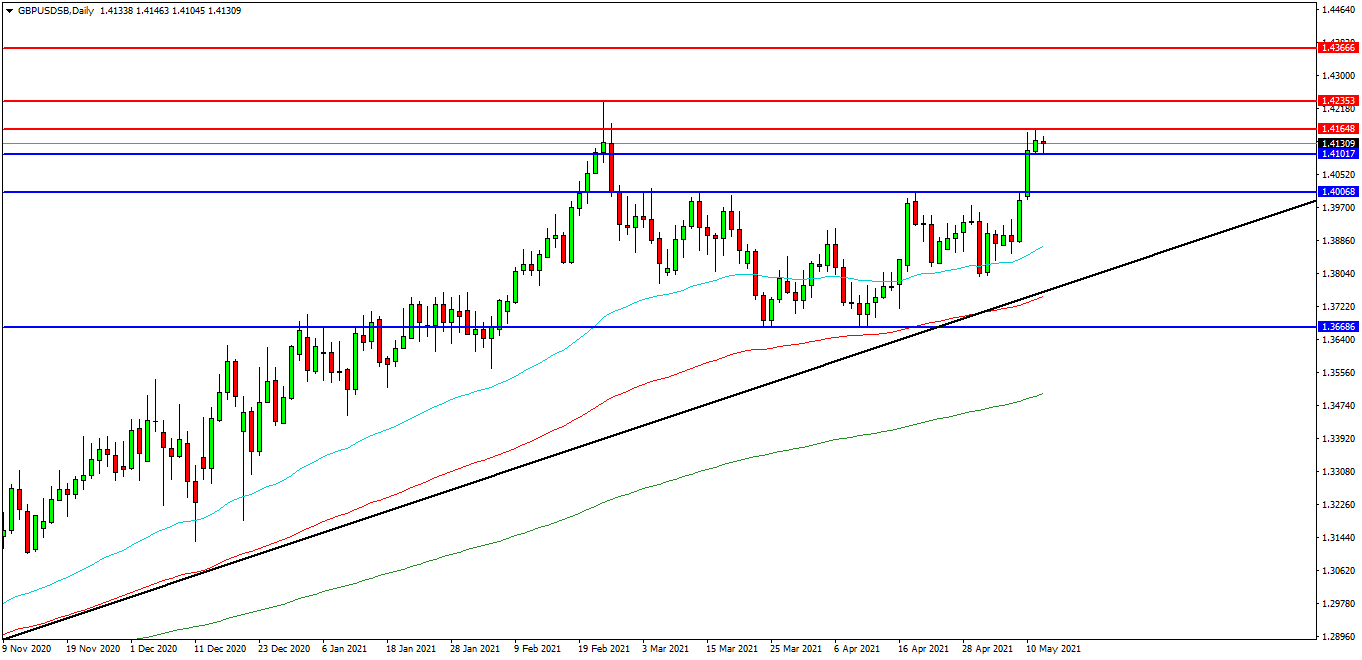
GBPUSD
The GBPUSD FX pair is moving higher after it found support to start the month at 1.3800. Price tested support at the 50 EDMA in this area last week and is now trading at 1.4130. Price is using the EDMAs as support. A confirmed breakout above 1.4168 may open the way to initial resistance at the 1.4200 area. The 1.4235 previous high level may provide a target along the way to the 1.4300 area. Alternatively a move back down under the 1.4000 zone may find initial support at 1.3950. The 1.3900 area may be used as support followed by further supports at 1.3825 and 1.3755 at the trend line and the 100EDMA.
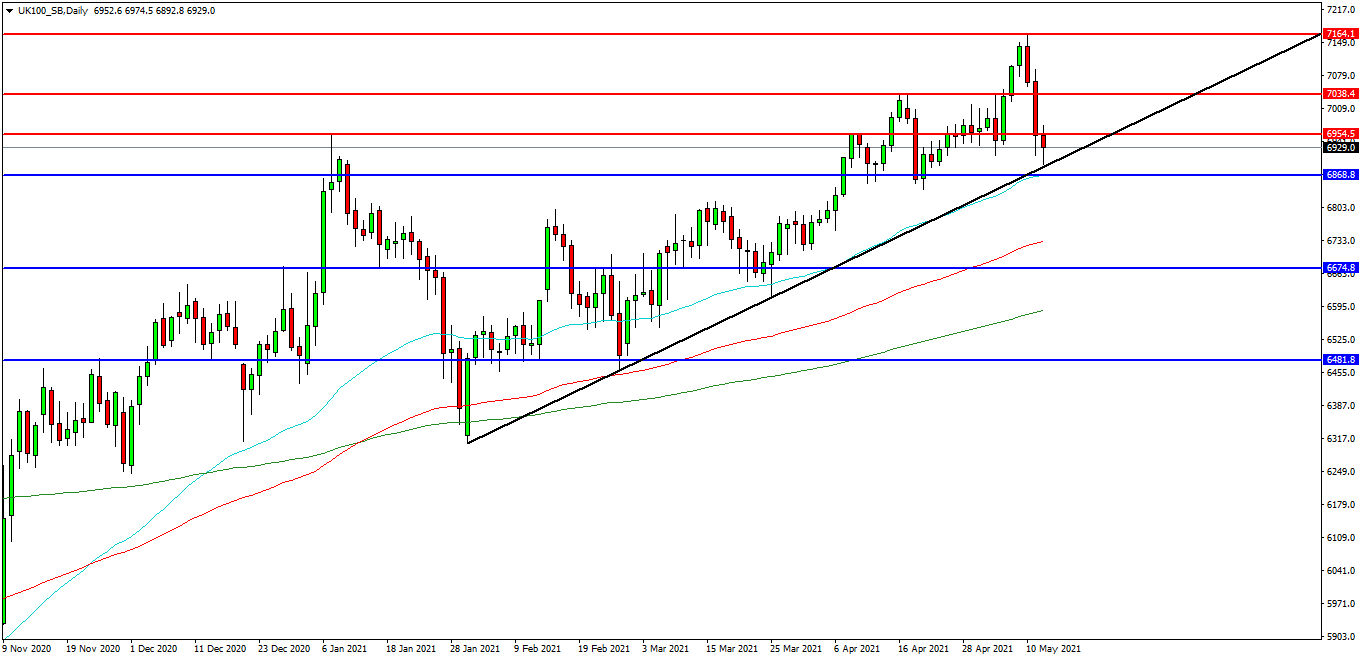
UK 100 INDEX
The UK 100 Index created a high at 7166.00 on Monday and this is now the area that traders are seeking to break. If the market fails to get back to this level, it may act as resistance. The market sold off yesterday but found support on the rising trend line overnight. Price pulled back to the 6900.00 area and found support. Price is attempting to build on this support and at present 6920.00 looks like a potential area followed by the 6954.00 level. A move higher from the current level may target resistances at the 6980.00 area and 7000.00. Beyond this level, 7038.00 may offer resistance followed by the 7100.00 level. Alternatively, a move back below 6900.00 may signal a test on the trend line support at 6990.00. Below this level the 6868.00 area may be used as support along with 50EDMA and the 6850.00 level. A run below this support may quickly target the 6800.00 followed by 6730.00.
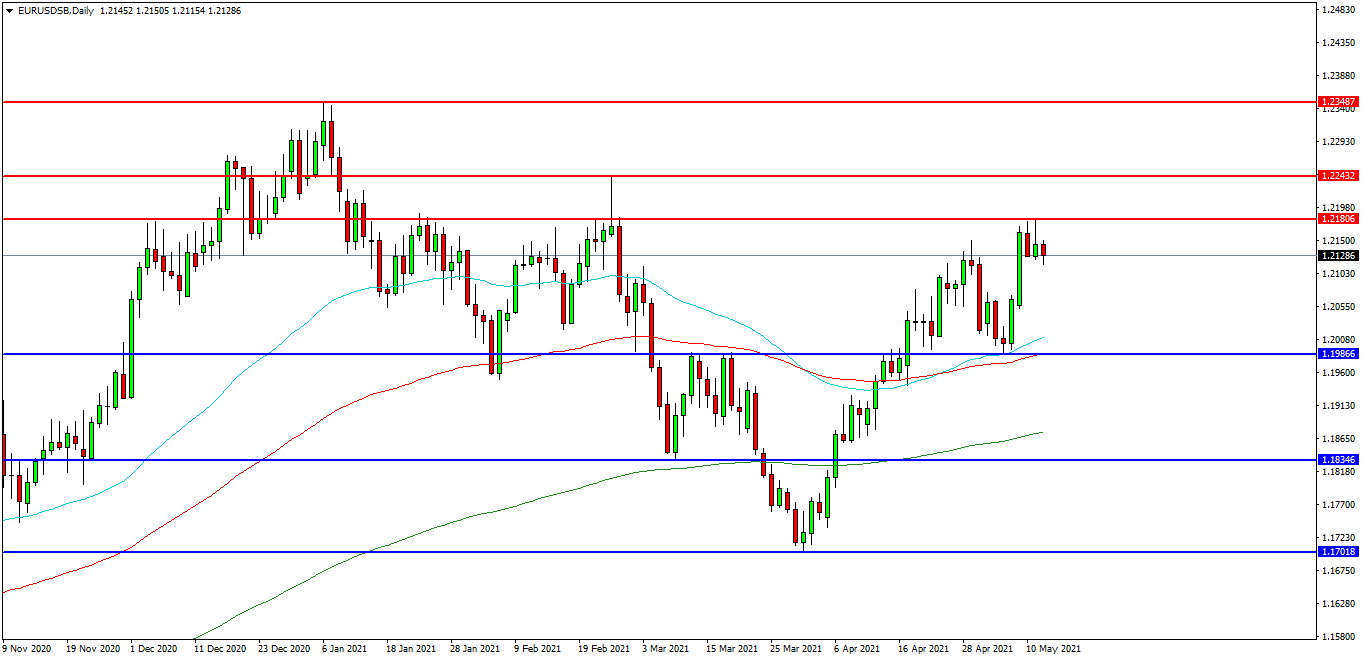
EURUSD
The EURUSD chart is showing how the pair has moved higher over recent weeks and is now trading at 1.2128 and testing resistance at 1.2180. The 1.2200 level is expected to act as resistance and 1.2100 area is the initial support area. The pair may find resistance at the 1.2243 area on a break higher. A continued move higher may find more resistance around the 1.2300 level followed by the 1.2350 area. Alternatively a move back down under 1.2050 may find supports between 1.2000 and 1.1960. A loss of this level may extend the control of sellers and possibly open the way to a test on 1.1865. Below this level the 1.1835 area may play its part as support ultimately followed by 1.1700.