3Sigma Markets – Mid Week Macro Report March 31st 2021
The MV Ever Given was freed from the Suez Canal earlier this week, literally removing a physically obstacle for further bullish sentiment. This victory was short-lived as the fallout and further ramifications from the Archegos Capital implosion are filtering through into the market today. This morning UBS has been reported as sustaining “at least low three digit millions in losses” from the fallout of the blow-up of the fund. The Swiss based bank joins its contemporises Credit Suisse, Goldman Sachs, Morgan Stanley and Nomura, whom have also taken losses as a result of the forced liquidation. Credit Suisse issued a profit warning and is reportedly still unwinding its positions. Although the numbers in question are huge, the fund is not large enough to have a wider contagion effect, however the cause of its collapse – over leverage – should not be swept under the carpet – Archegos is not the only player in this position. In saying all that the markets have continued to chug higher at present with a broad range of stocks making new highs, as we continue to observe this sector rotation process – out of tech and into sectors like Energy and Industrials. Technology and Finance are lagging as 10 Year Treasury Yields in the US inch closer to 2%. Markets are once again shifting their focus towards Friday’s US Non-Farm Payrolls data release – having more and more focus at present given the shift in the US Fed towards AIT. The release will take place on a holiday for many global markets in illiquid conditions and this may lead to a paring of positions heading into the weekend. Forecasts suggest that the US Economy will add significant jobs on Friday and the Unemployment rate will fall to 6.0% from 6.2% – this maybe the one of the reasons behind the move this week higher in US yields. Economic data is trending higher in the US creating demand in stocks and rising expectations for inflation. This is spilling over into the USD and Bonds, with stock indices at or close to all-time highs. The only stand out to this is the Nasdaq, which is feeling the rotation process discussed above and is also sensitive to rising global yields. Much of the optimism is linked to reopening and the vaccine rollout but COVID-19 cases are rising once again with 70,000 new cases announced yesterday in the US. US CDC Chief Dr Rochelle Walensky warned that “Vaccines don’t work until they hit people’s arms — and we just don’t have enough vaccinations in people’s arms yet to be able to achieve the kind of herd immunity that we need”.
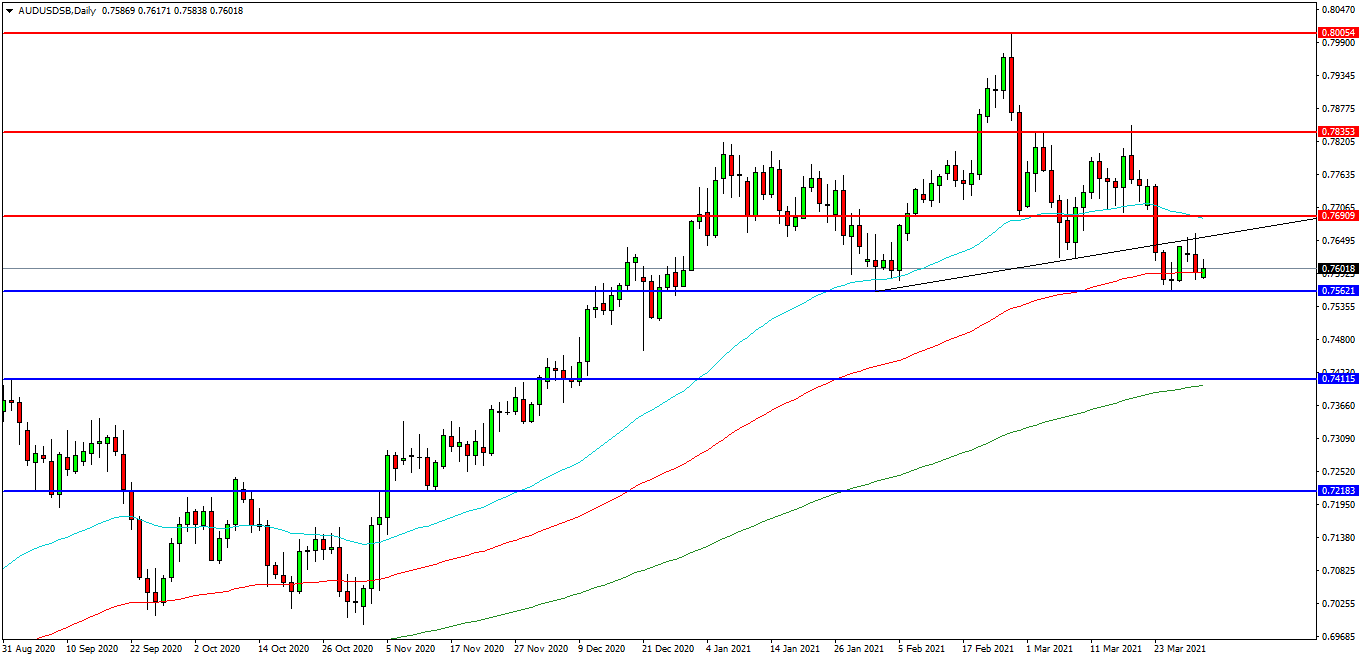
AUDUSD
The AUDUSD FX pair is consolidating after making new highs last month. The price has moved up to test 0.8000 as resistance. Price has fallen back and found support at 0.7560 and is now trading at 0.7600. Price fell under the trend line last week and is trading the 100EDMA. A confirmed breakout above this line may open the way to initial resistance at 0.7690 followed by the 0.7700 area. The 0.7835 level may provide a target along the way to the 0.8000 area. Alternatively a move back down under the 0.7600 zone may find initial support at 0.7560. The 0.7500 area may be used as support and the 200EDMA are may be of importance around 0.7400. Further supports may be seen at 0.7340 and 0.7300.
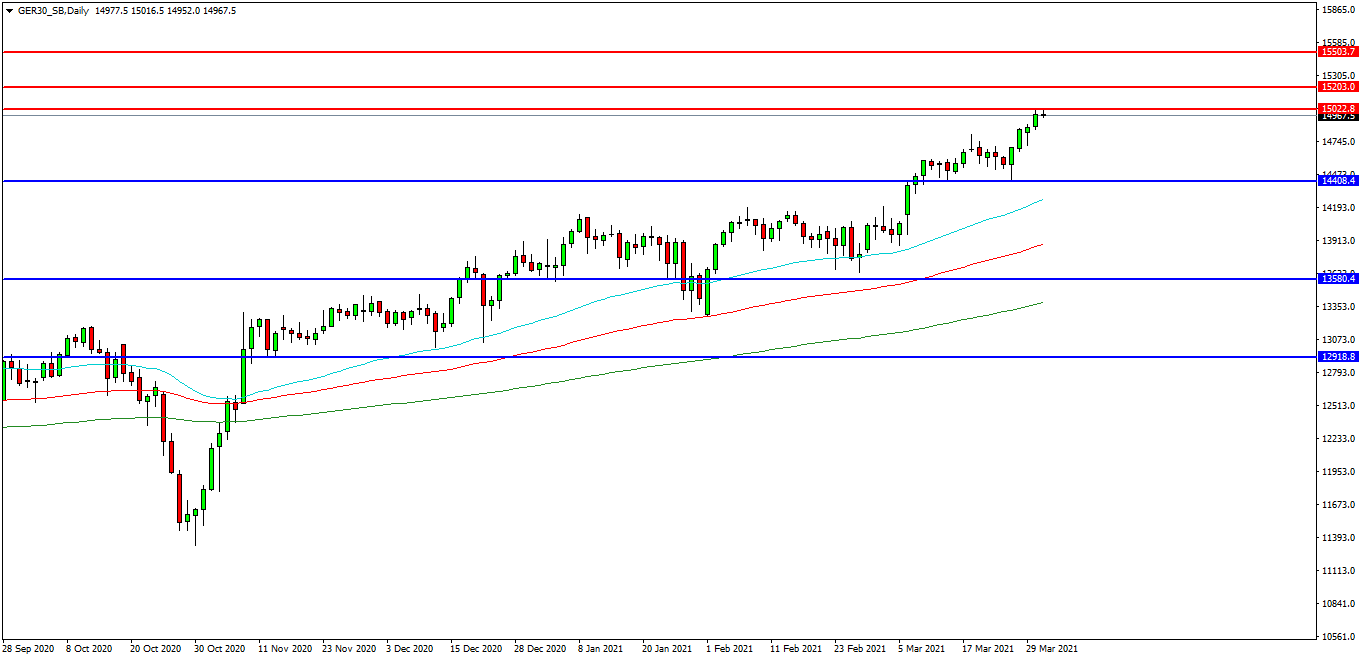
German 30 Index
The German 30 Index created a high at 15032.00 yesterday. The market is testing the 14900.00 level as support. Price is attempting to find resistance and at present 15032.00 looks like a potential area followed by the 15200.00 level. A move higher from the current level may target resistances at the 15280.00 area. Beyond this level, 15500.00 may offer resistance followed by the 15620.00 level. Alternatively, a move back below 14750.00 may signal a test on the support at 14400.00. Below this level the 14230.00 area may be used as support along with the 14000.00 level. A run below this support may quickly target the 13900.00 followed by 13880.00 as the 100EDMA.
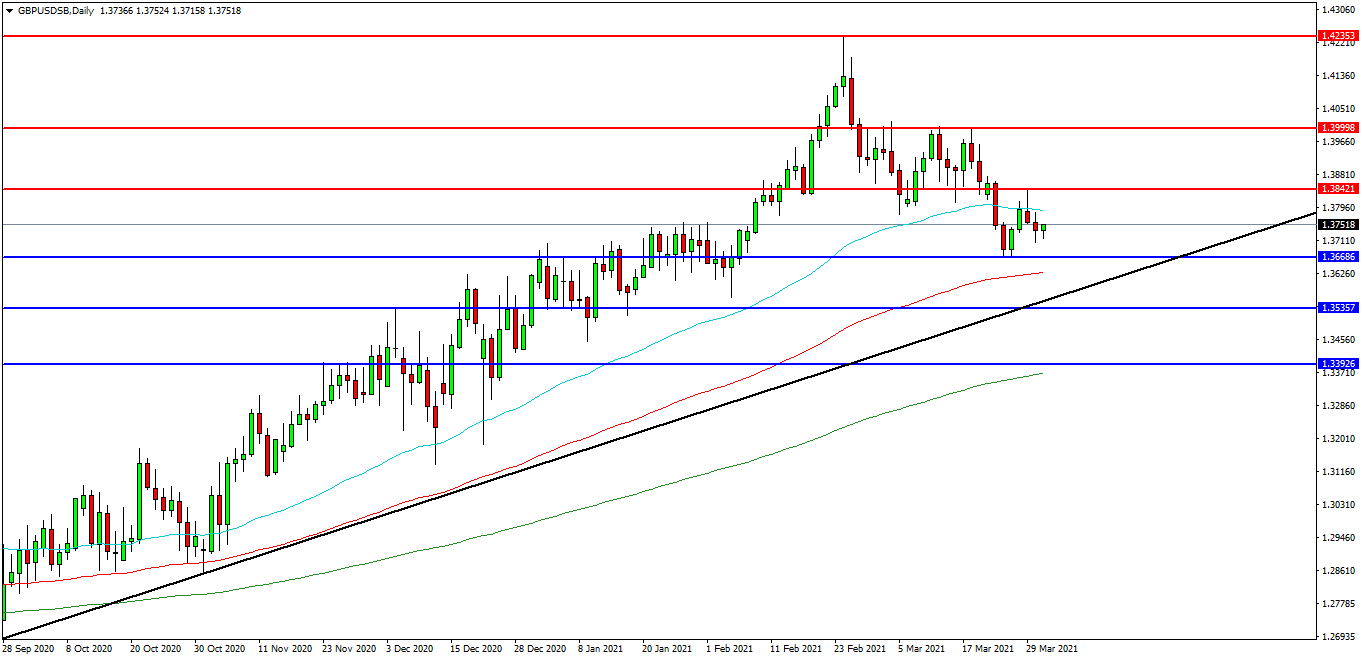
GBPUSD
The GBPUSD chart is showing how the pair has weakened considerably in recent weeks and is now trading at 1.3750 after having found resistance at 1.4235. The 1.3842 level is acting as resistance and 1.3666 area is the initial support area. The pair may find resistance at 1.3789 followed by the 1.3800 area. A continued move higher may find more resistance around the 1.4000 level followed by the 1.4120 area. Alternatively a move back down under 1.3650 may find initial supports at 1.3630 and 1.3600. A loss of this level may extend the control of sellers and possibly open the way to a test on 1.3560 trend line. Below this level the 1.3500 area may play its part as support ultimately followed by 1.3930.