3Sigma Markets – Mid Week Macro Report April 28th 2021
The equity indices are still chopping around in tight ranges at their all time highs this week as they await further earnings reports from US companies and the FOMC’s view on the market this evening. Earnings reports in the US have so far failed to move the market to any great extent. After the market closed yesterday the focus narrowed in on the earnings from Google which beat estimates and rallied, followed by Microsoft which also beat its estimate but whose share price sold off. US equities have failed to get excited by more stellar results from the tech sector. The Nasdaq failed to make fresh highs this week – are we fulIy priced in here? The market will continue to focus on earnings this week as the large FANG tech companies continue to report. However the FOMC will attract attention later today as the FED decides how to gauge the economy going forward. With improvements in unemployment and consumer spending expected to continue as the vaccine is rolled out, the FED will have to start considering tapering asset purchases in the months ahead. The market will be zoned in on the FED’s signals as to when this may take place. The FED continues to state that the rising inflation is transitory, caused by production and supply disruption due to Covid-19. However there is also inflation that is driven by the flooding of the market with liquidity from monetary and fiscal stimulus which may be less transitory and may have a longer lasting impact on the economy. The FED will eventually have to deal with this by rising rates and it may take the government to act to decrease regulation if inflation gets too hot for the FED alone to handle. The market is on tender hooks this week and is unlikely to make a clear break higher or lower until it has a more solid handle on the economic landscape with earnings and the FED. The US 10 Year has also risen back up to 1.64% and looks to test 1.7% followed by 2.0%. This may disrupt the rally in tech and spill over in FX through a rally in the US Dollar. We are already seeing the first signs of this particularly in USD/JPY – US yields have begun to rally again into the Fed meeting this evening as the market anticipates that the Fed’s hand maybe forced earlier than they are outlining to the market and this move in US rates has wide spread consequences for all markets. It will be interesting to see how Fed chair Powell deals with questions surrounding this topic in the press conference post announcement.
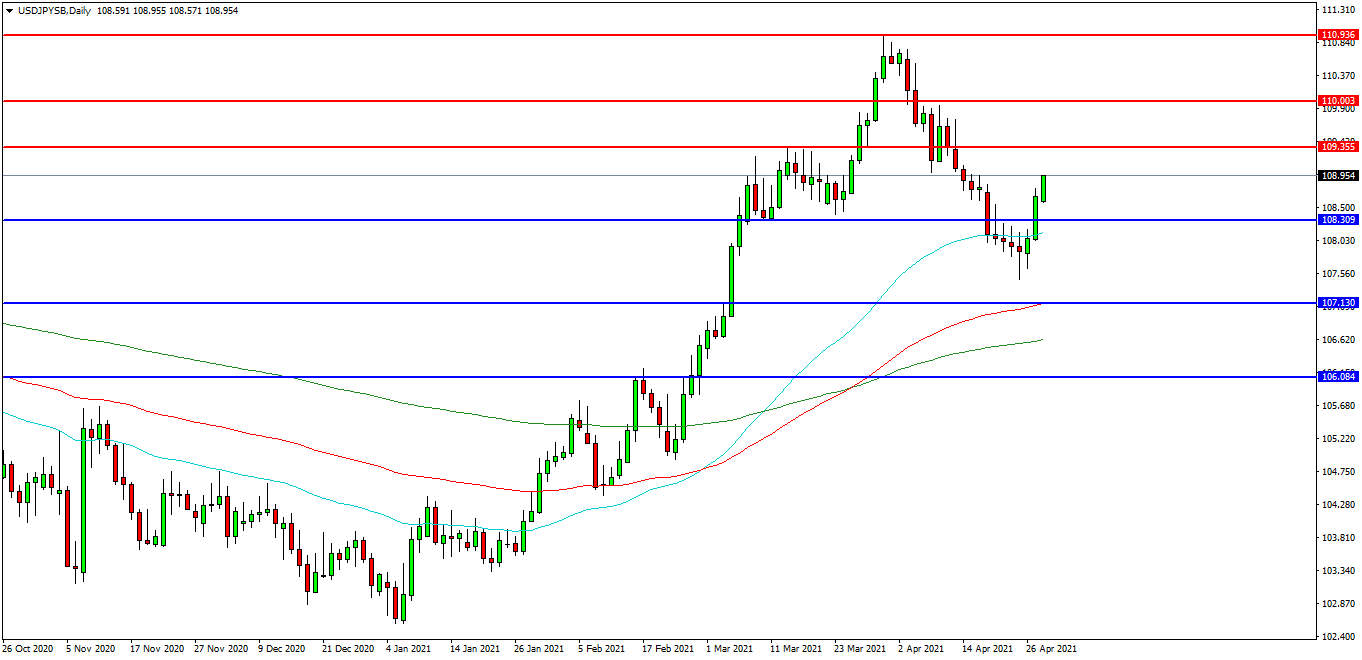
USDJPY
The USDJPY FX pair is moving back up towards the high it made to start the month at 110.930. Price found support at 107.470 last week and is now trading at 108.954. Price fell through the 50EDMA at 108.100 but is now trading back above this level. A confirmed breakout above 109.000 may open the way to initial resistance at the 109.355 area. The 110.000 level may provide a target along the way to the 110.930 area. Alternatively a move back down under the 108.500 zone may find initial support at 108.100/108.000. The 107.130 area may be used as support followed by further supports at 106.620 and 106.000.
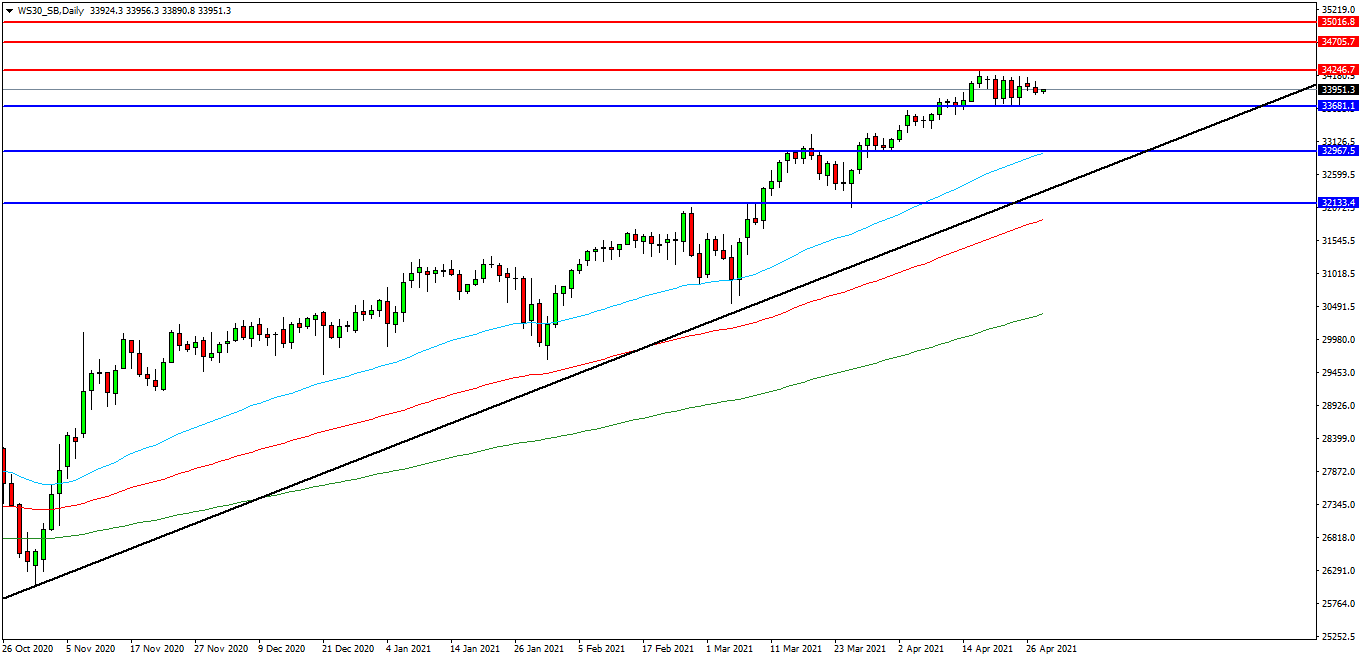
WS 30 INDEX
The WS 30 Index created a high at 34250.00 earlier in the month and this is now the area that traders are seeking to break. The market has failed to get back to this level and it may act as resistance on approach to 35000.00. Price pulled back to the 33680.00 area and found support. Price is attempting to build on this support and at present 33870.00 looks like a potential area followed by the 33800.00 level. A move higher from the current level may target resistances at the high followed by the 34300.00 area. Beyond this level, 34700.00 may offer resistance followed by the 35000.00 level. Alternatively, a move back below 33500.00 may signal a test on the support at 33000.00. Below this level the 32500.00 area may be used as support along with the 32000.00 level. A run below this support may quickly target the 31880.00 followed by 31000.00.
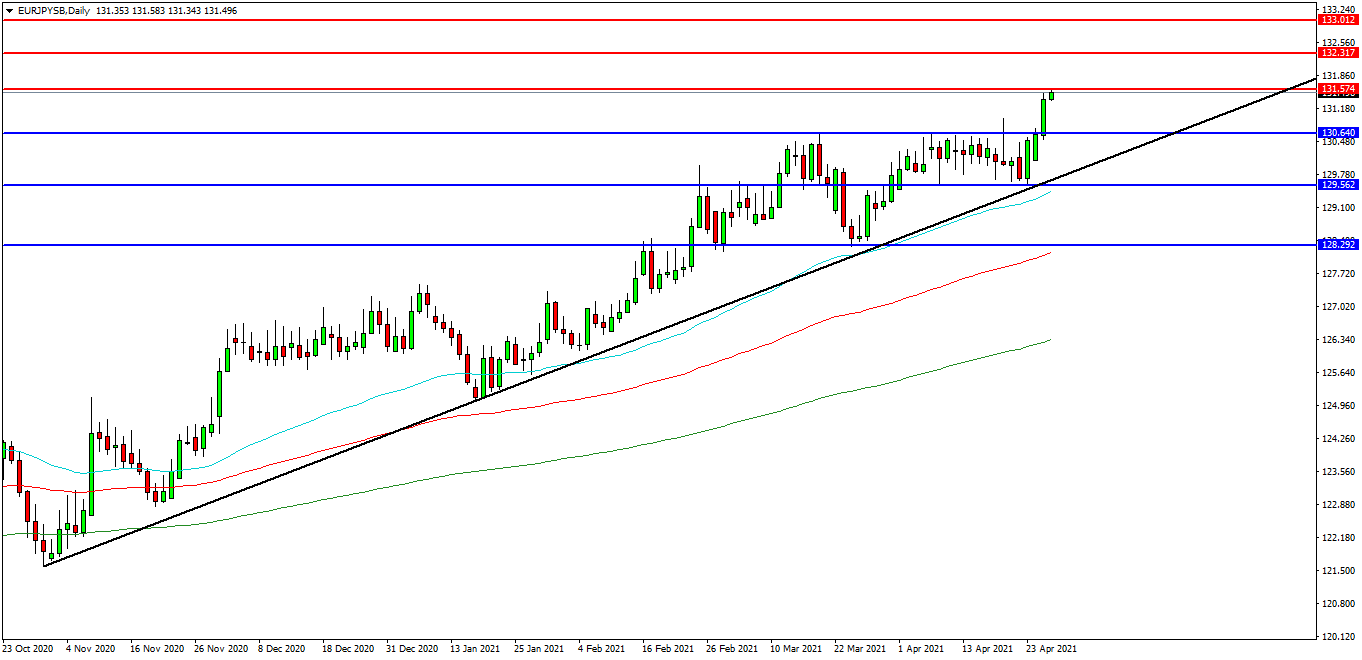
EURJPY
The EURJPY chart is showing how the pair has rallied in recent weeks and is now trading at 131.500 and testing resistance at 131.575. The 132.000 level is expected to act as resistance and 131.000 area is the initial support area. The pair may find resistance at the 132.315 area on a break higher. A continued move higher may find more resistance around the 132.600 level followed by the 133.000 area. Alternatively a move back down under 131.000 may find supports at 130.640 and 130.000. A loss of this level may extend the control of sellers and possibly open the way to a test on 129.730. Below this level the 129.500 area may play its part as support ultimately followed by 128.300.