3Sigma Markets – Mid Week Macro Report April 21st 2021
The move higher in asset prices appears to have taken a hit yesterday as some profit taking emerged off of all time high valuations – this was led by European equity markets, which filtered in the US stock markets. As long as the profit taking doesn’t trigger a liquidity shortage, it is likely that the markets will resume their risk on trend in a few days – as we have seen time and time again. However with high levels of leverage in the market – we have seen this story enmerge over the past few weeks, some participants may be forced to sell and this might trigger a cascade of lower prices as selling begets selling – something to keep on your radars. This means that the current pullback carries a great deal of significance for the market, with the potential to unlock much higher or much lower levels. There has already been a move out of equities by institutions over the last 3 weeks while retail investors have carried the equity markets to new highs over that time. With the prospect of more stimulus cheques miniscule, there is a concern that the market is ripe for a larger decline. At the moment economic data and the reopening of the economy in the US is supporting the narrative of higher prices, but unless there is capital available to support prices in the event of a pullback, the market may revert towards it mean valuations. The Bank of Canada and the ECB are due to release their monetary policy statements today and tomorrow respectively and this may impact prices in the Canadian Dollar and the Euro. Bitcoin fell dramatically over the weekend leading markets lower, having close below the 50 dma which we have now highlighted on many occasions – it has defined the up-trend since Oct 2020. It’s too earlier to tell whether this will bring a deeper correction in the crypto giant, but there are a few worrying signs that are worth highlighting. The fresh highs in Bitcoin made 2 weekends ago appear to be on the back of historic Coinbase IPO. The move above $64,000 was fleeting and it creates concern over the ‘’buy the rumour, sell the fact’’ analogy. In saying that Coinbase’s share price has held up relatively well over the preceding trading sessions and in the face of some risk off moves elsewhere in the equity space. The stock markets, as highlighted above, are certainly not clear of the risk and the next 3 trading sessions will be very telling. As with the move in Bitcoin above $61,000 on March 14th, we have already seen over a 18% retracement/correction – which was met with demand – this comes in at $51,707, which needs to hold in the short term.
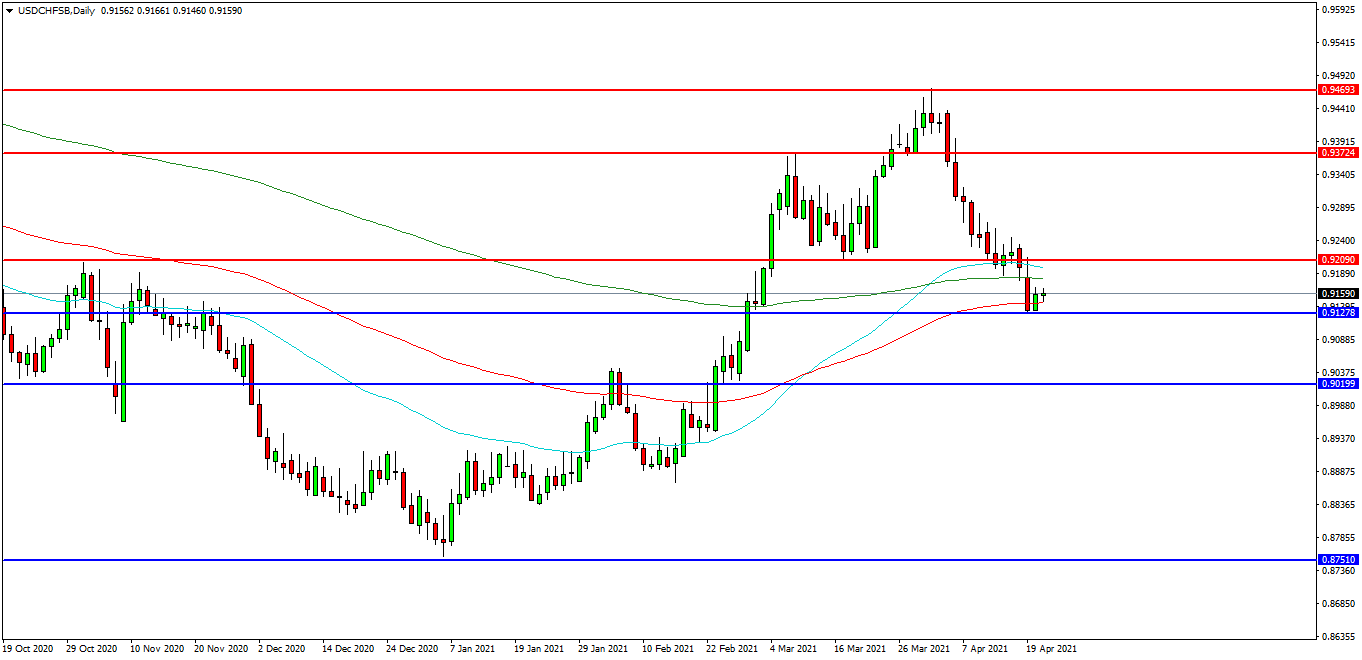
USDCHF
The USDCHF FX pair is moving back lower after making new high to start the month at 0.9471. Price has fallen back from the lower high of 1.1117. Price fell back to test the 50EDMA but is now using the 100 EDMA as support around 0.9140. A confirmed breakout above 0.9200 may open the way to initial resistance at the 0.9240 area. The 0.9300 level may provide a target along the way to the 0.9470 area. Alternatively a move back down under the 0.9150 zone may find initial support at 0.9125. The 0.9000 area may be used as support followed by further supports at 0.8925 and 0.8750.
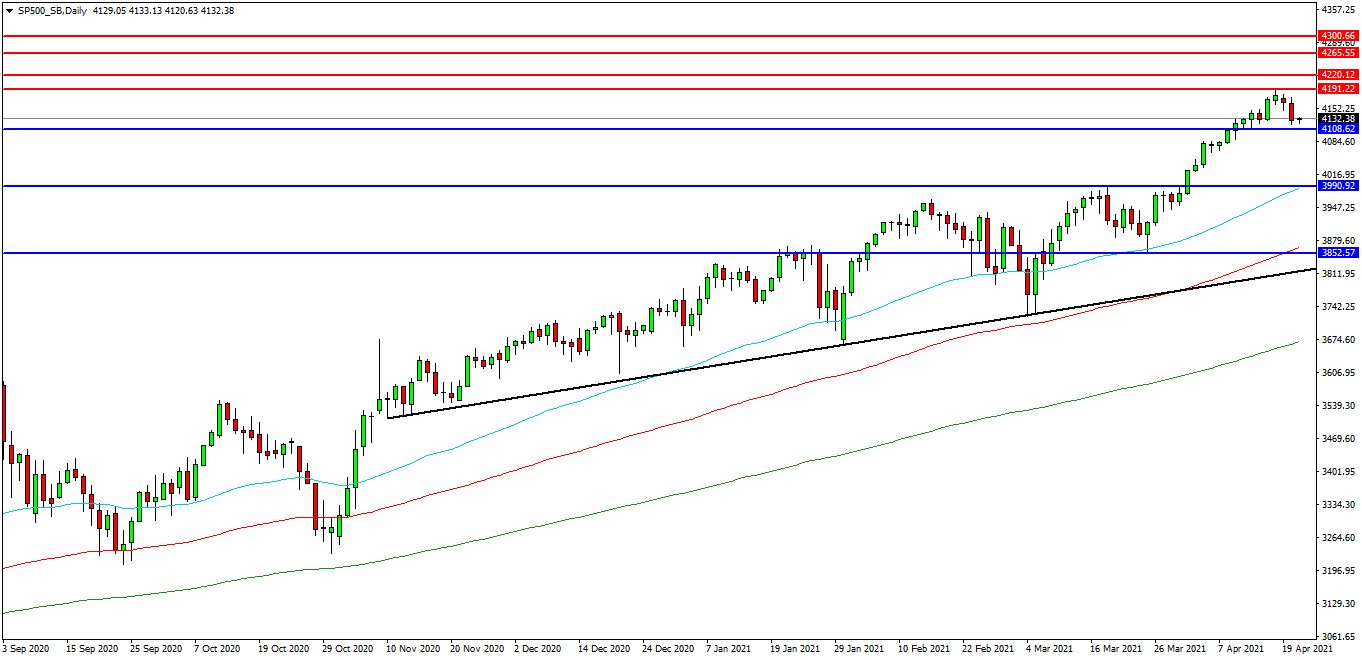
US 500 Index
The US 500 Index created a high at 4190.00 last week and this is now the area that traders are seeking to break. The market is tested this level as resistance on approach to 4200.00 but pulled back to the 4130.00 area. Price is attempting to find support and at present 4120.00 looks like a potential area followed by the 4100.00 level. A move higher from the current level may target resistances at the high followed by the 4200.00 area. Beyond this level, 4220.00 may offer resistance followed by the 4265.00 level. Alternatively, a move back below 4100.00 may signal a test on the support at 4080.00. Below this level the 4000.00 area may be used as support along with the 3990.00 level. A run below this support may quickly target the 3852.00 followed by 3820.00.
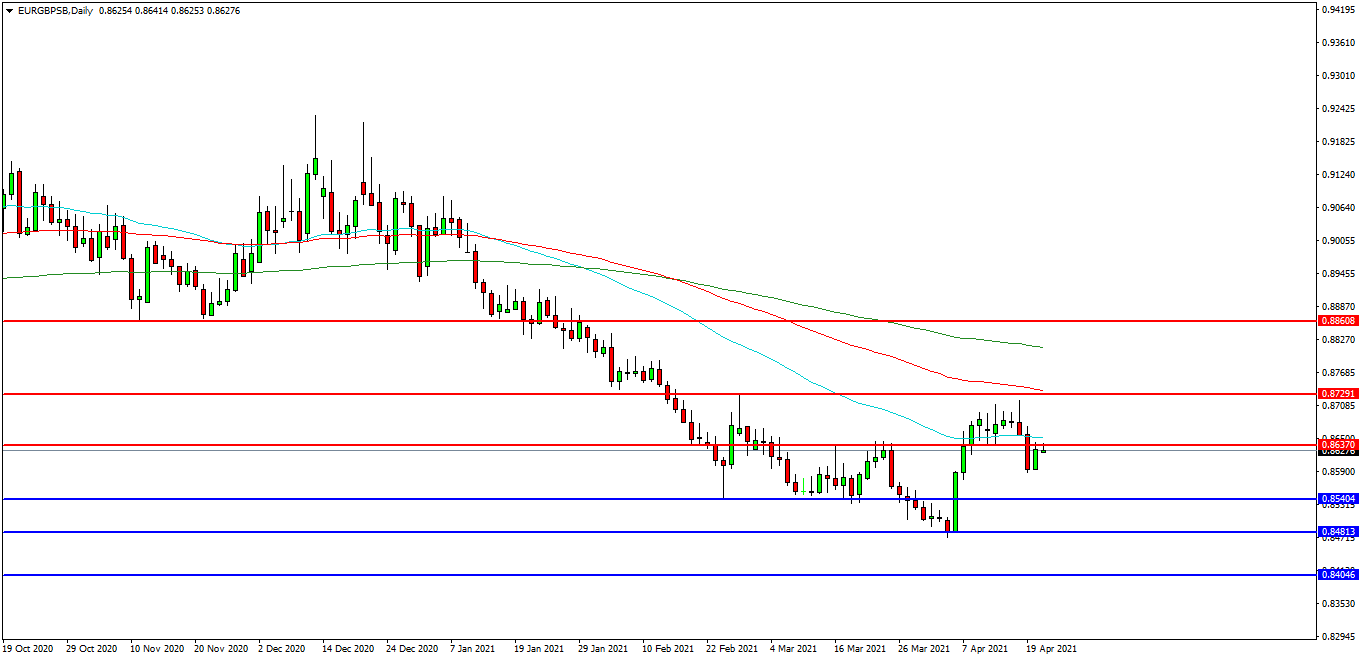
EURGBP
The EURGBP chart is showing how the pair has weakened considerably in recent weeks and is now trading at 0.8627 and testing resistance at the 50 EDMA at 0.8650. The 0.8700 level is expected to act as resistance and 0.8600 area is the initial support area. The pair may find resistance at the 50 EDMA followed by the 0.8720 area. A continued move higher may find more resistance around the 0.8735 level at the 100 EDMA followed by the 0.8800 area. Alternatively a move back down under 0.8588 may find supports at 0.8540 and 0.8500. A loss of this level may extend the control of sellers and possibly open the way to a test on 0.8480. Below this level the 0.8450 area may play its part as support ultimately followed by 0.8400.