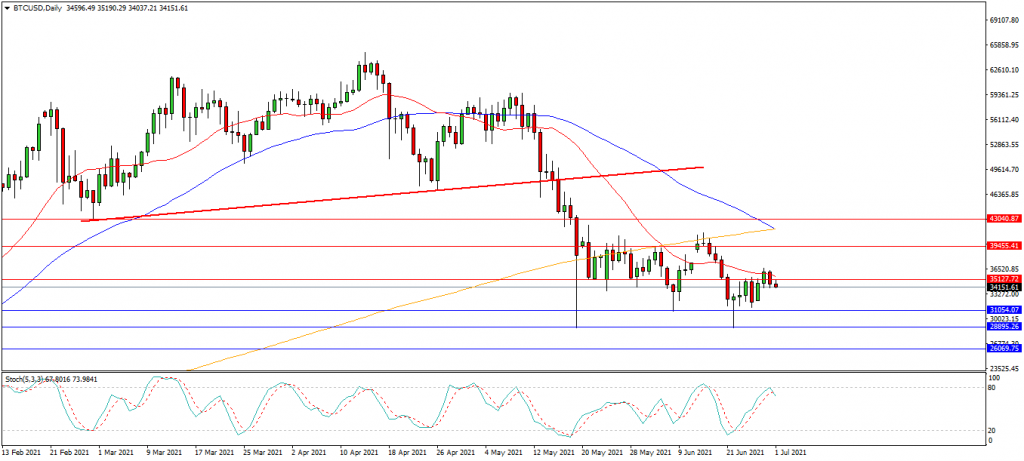
Bitcoin
The selloff from 64,000 fell into the important 30,000 support zone and retraced up to the 42,000 area in May before consolidating below 40,000. The 42,000 area was retested as resistance alongside the 200 Day Moving Average and price is currently trading at 34,150. The 20 Day Moving Average at 35,600 is being used as resistance and may see sellers emerge to test lower support levels at 30,000 and the double bottom at 29,000. The low set during May at 28,850 may then become a target. Alternatively if buyers can regain 36,000, and the 20 Day moving Average the path to 38,000 opens up and may lead on to a test on 41,300 and the 46,000/48,000 potential resistance area. A breakout higher may see price consolidate between the 50,000 area and the neckline of the head and shoulders pattern.
Potential Trade Set Up:
The potential trade setup for this market requires a break above 41,850 that may trigger a double bottom trade with targets at 44,000 and 47,500, up to 55,000. Alternatively a fall under the 28,900 invalidates this trade as sellers potentially gain more control over direction.
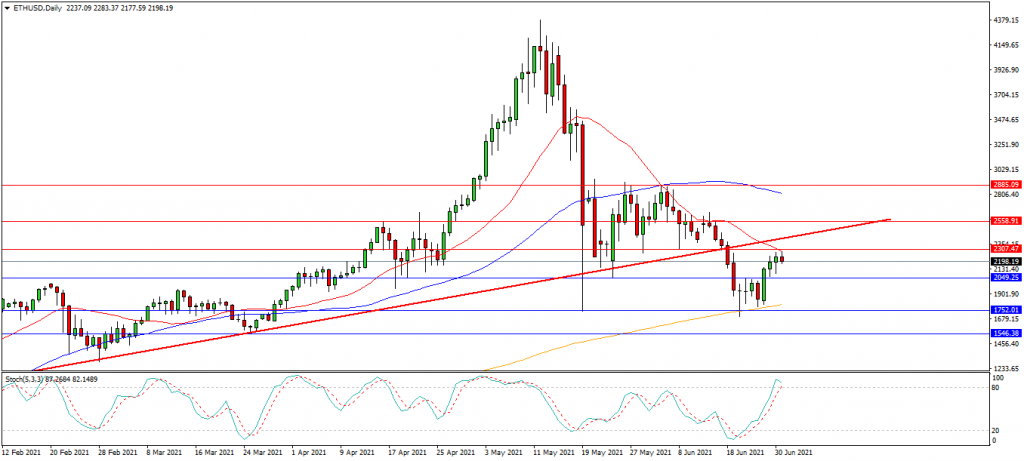
Ethereum
Ethereum found support around the 1750.00 area in May and staged a recovery to test 2911.00 but is currently trading around 2195.00. This crypto traded higher to the 2915.00 level and the resistance at the 20 day and 50 day moving averages from the May low but the 20 Day moving average has slipped lower since last week and is being used as resistance around 2300.00. A break above this area and the 2500.00 area targets the former higher low at 3120.00 followed by the 3550.00 area. A break above this zone may open the way to 4000.00 and the high at 4373.00. Alternatively if sellers re-emerge at the trend line on a retest, support may be seen around the 2050.00 level. A loss of these levels opens the way to a test on the 1920.00 area followed by the higher low at 1750.00 supported by the 200 Day moving average. A loss of the 1725.00/1700.00 area may open the way to 1300.00/1295.00.
Potential Trade Set Up:
A potential trade may emerge if the pair can create a bullish rally above 2580.00 and a break above the trend line, with targets at 2900.00, 3300.00 and 3500.00. However a loss of the 2000.00 area would invalidate this idea.
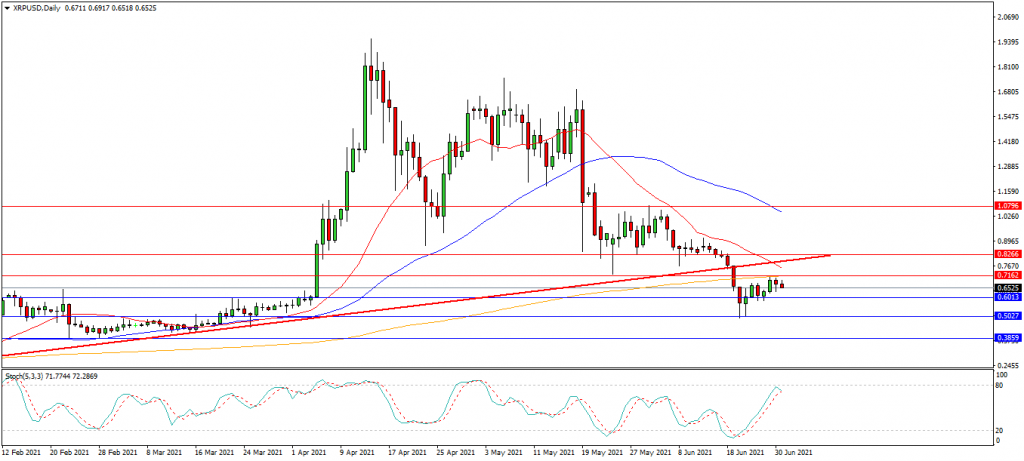
Ripple
The chart is showing that Ripple is consolidating at 0.6525, following the selloff and breakdown under the trend line last week. The chart suggests that this market is in a down trend pattern of lower lows and lower highs since mid April. Price is currently trading below the 200 Day moving average and forming a bear flag or wedge around 0.6275. A break above the 200 day moving average at 0.7160 will be needed to retest the trend line and may suggest a test on the 1.0000 level. This may lead to a push towards the 1.0800 level followed by targets at 1.2000 and 1.3120. Alternatively a confirmed use of the trend line at 0.7700 as resistance puts pressure on the 200 day moving average at 0.7160. A loss of this level potentially opens the way to the low at the 0.5000 area and the February low at 0.3835.
Potential Trade Set Up:
A potential trade may emerge with a move up through 0.8000 looking for a test on potential the resistance targets around 1.1000 and 1.1600. Further targets come into focus at 1.2500 and 1.3000. A drop under 0.5000 negates this idea.