3Sigma Markets – Mid Week Macro Report 29th September 2021
The markets are focussing on global bond markets and the rise in yields at present with equities declining and a general tone of risk aversion entering the space. The risk off tone is being particularly badly felt in the tech sector with a rotation out of tech and into value taking place in equities. This was very evident in the Nasdaq yesterday, which was the worst performing of the US stock markets. The Nasdaq felt this rotation and was compounded by its sensitivity to higher rates. Energy commodities softened a little after they rallied hard in recent days. However with fuel shortages in the UK and higher prices across the energy block, it is anticipated that prices will continue to rise into the winter. This is being coupled with supply and distribution disturbances across many sectors, further increasing prices and signalling continued rising inflation. The US Federal Reserve has signalled that it will taper asset purchases and the prospect of rate increases are already being discussed but in the context of the first rate hike taking place in 2023. Rampant rises in inflation may bring forward the timeline for hikes. As the end of the month/quarter approaches, traders, corporates and fund managers will be rebalancing their positions and this may result in some more unusual moves across markets. Volatility should increase over the next 2 days and create exaggerated moves, which in turn can bring good trading opportunities. Good luck out there.
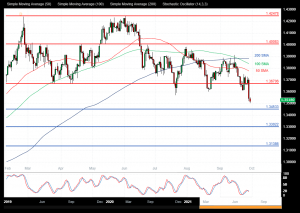
GBPUSD
The GBPUSD FX pair is trading at 1.3520 after breaking below the 1.3600 level as support and testing lower to the 1.3500 area overnight. Price tested resistance at the 1.4250 area in June creating a double top. The pair is pushing lower this week after running into resistance around 1.3900 and consolidating. Price is using the 1.3700 area as resistance in the short term. A confirmed breakout above this level and the 50 SMA, opens the way to resistance at the 1.3850 area followed by 1.3900 as the 200 SMA followed by the 1.4000 area. Alternatively a move back down under 1.3500 opens the way to support at 1.3450. This area of support is followed by further supports at 1.3300 and 1.3185.
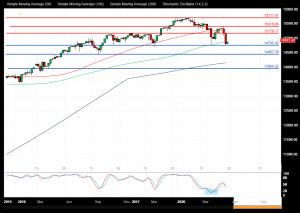
US 100 Index
The US 100 Index created a high at 15700.00 last month and is now testing the support area of the last higher low around 14800.00. The area of support is corresponding to the neckline for a head and shoulders pattern that has triggered with a loss of 14900.00. The pattern would become invalid with a move back above 15179.00 and a push over 15500.00. If the market breaks above the resistance area at 15416.00, the way opens back to the high at 15711.00. Further resistance comes onto the chart at 15900.00 ahead of 16000.00. Alternatively, a move back below 14750.00 signals a test on the support at 14450.00 The 14230.00 area then becomes supportive followed by the 14000.00 round number level. Below this level the 13965.00 area would be used as support along with 13480.00 as a significant higher low.
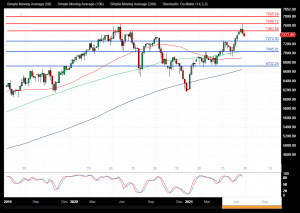
Crude Oil
The Crude Oil chart is showing how the price has moved back up to test the former high around 7650.00 after reaching a higher low at 6200.00 in August. With price now trading at 7375.00 as it resistance can be seen at 7500.00 and support at 7270.00. The 7600.00 area is expected to act as resistance in the short term as it relates to the July high. A break above this level would find resistance ahead of 7650.00 as that high. A continued move higher finds more resistance around the 7700.00 and 7760.00. A breakout from there opens the way to 7800.00. Alternatively a move back down under 7270.00 would find supports at 7040.00 and 7000.00. A loss of this level extends the control of sellers and opens the way to a test on 6730.00 area.