3Sigma Markets – Mid Week Macro Report 21 July 2021
US Equity Markets recovered yesterday from the selling over the last week of trading and final flush out lower on Monday. The rebound was triggered by short term oversold conditions in markets and a rebound in bonds and other assets. US 10 Year Bonds touched a low of 1.126% in yield terms, before rebounding back above 1.2% during yesterday’s trading session. However both technical and fundamental indicators are flashing warnings for the equity markets. The technical overbought conditions in markets are coinciding with resistance levels such as the double top in the Wall St 30 Index. Resistance trend lines are also in play and key technical supports have been broken over the last few days. Economic data releases are also weakening as the reopening loses steam and Covid-19 cases rise in many nations. Concerns over the rise in Covid cases was a factor in the selling that took place during the week, with traders fearing a return to lockdowns and the economic fallout that that would bring. In the US pandemic unemployment payments are due to expire at the end of August and this is also creating worry that a source of capital will dry up as well as fuelling the spread of the virus if workers are forced to return to employment will being infectious. As concerns mount there is a strong possibility that markets go into full risk off mode due to the high amount of leverage in some quarters and that Monday’s price action in all asset classes was a window to a larger ‘’risk off’’ move – something to monitor and keep on your radar screens.
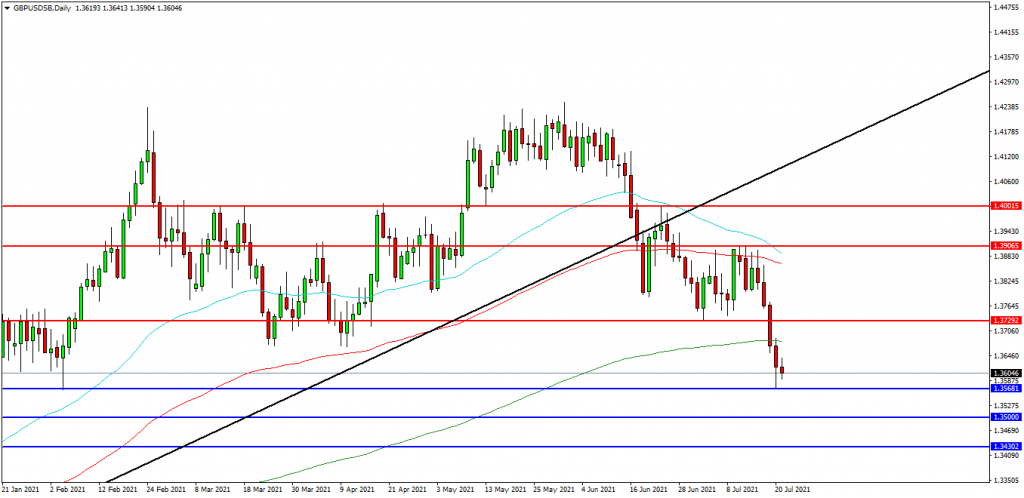
GBPUSD
The GBPUSD FX pair is trading at 1.3600. Price is above its supporting 1.3568 area. Price tested resistance at the 1.4233 level in May and created a new high at 1.4248 in June but then sold off. The pair is trading down since then and seeking elusive support. Price is using the 1.3680 area as resistance. A confirmed breakout above 1.3700 may open the way to resistance at the 1.3730 area. The 1.3800 area may provide a target along the way to the 1.3870 area. Alternatively a move back down under 1.3570 and the 1.3565 zone may find initial support at 1.3500. The 1.3460 area may be used as support followed by further supports at 1.3430 and 1.3400.
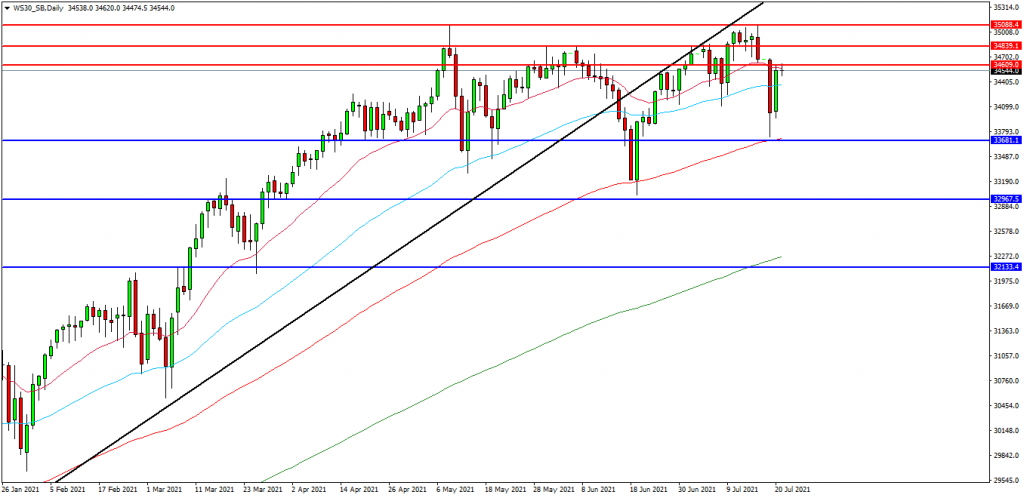
Wall St 30 Index
The Wall St 30 Index created a new high at 35090.00 yesterday and is now testing the 34600.00 area as resistance. If the market breaks above this area, a test on the 35000.00 round number could be possible once again. The market sold off over the last number of days and found support at the 33735.00 area before recovering yesterday. Price is attempting to build on support at 34000.00 followed by the 34400.00/34480.00 area as support. A move higher from the current level may target resistances at the 34700.00 area and 34850.00. Beyond this level, 35000.00 may offer resistance followed by the 35090.00 level. Alternatively, a move back below 34400.00 may signal a test on the support at 34000.00. Below this level the 33700.00 area may be used as support along with the 33500.00 level. A run below this support may quickly target the 33280.00 followed by 33000.00/32965.00.
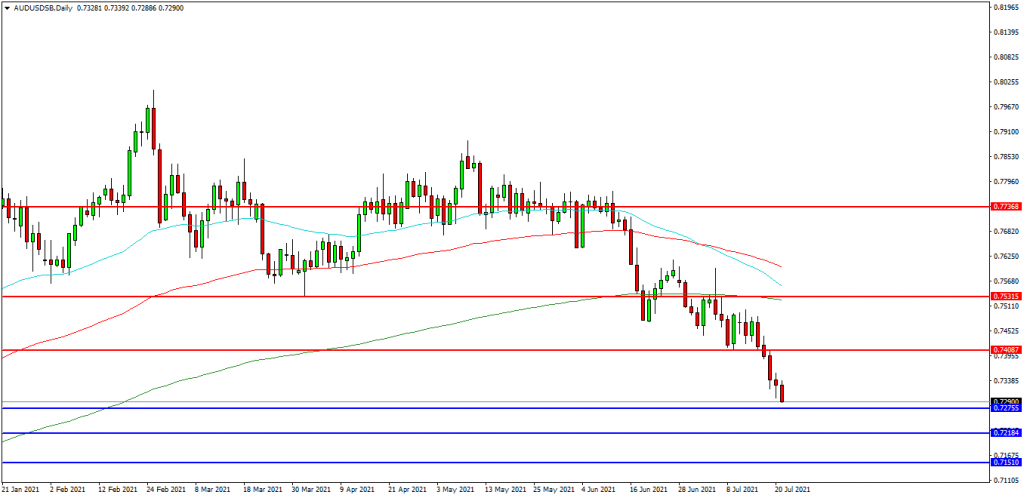
AUDUSD
The AUDUSD chart is showing how the pair has traded lower over recent days and the move is accelerating with price now trading at 0.7290. The 0.7350 level is expected to act as resistance and the 0.7275 area is the initial support area. The pair may find resistance at the 0.7400 area and the 0.7450 level on a break higher. A continued move higher may find more resistance around the 0.7500 level followed by the 0.7525/0.7530 area. Alternatively a move back down under 0.7275 may find supports between 0.7250 and 0.7218. A loss of this level may extend the control of sellers and possibly open the way to a test on 0.7200. Below this level the 0.7150 area may play its part as support as well as the 0.7100 area.