3Sigma Markets – Mid Week Macro Report 20 October 2021
To say the market is in a transitional period is a slight understatement. Global Central Banks are actively acting against the rise in inflation as interest rise or are set to rise. We are in the midst of a Global energy crisis as the northern hemisphere enters the winter months. Supply chain bottlenecks are filtering through into every aspect of the global economy. Covid-19, despite the roll of a successful vaccination campaign, continues to weigh heavily on our global health systems. All these cross winds make clear directional plays within the financial markets very tricky at present. They do however create volatility, which in turn creates opportunity, with many investors believing these next few months will be the start of a wider, more draw out trend in the financial markets. Something that has been difficult to come by in 2021 so far. So these are indeed exciting times for investors and traders. For us the key driver over the next few months and what will set the broader trend in all asset classes is the US Fixed Income markets. Yields are back rallying following their pause during the summer months as the broader markets are focussing in on the growing risk of inflation rising across the globe. The rise in energy and commodity prices in particular has been joined by increases in consumer goods prices, particularly food stuffs. Shortages are plaguing many retailers and earnings are expected to highlight supply chain issues and bottlenecks along with production difficulties and labour shortages. In saying that, 80% of the US corporates that have released their 3rd Q earnings have beaten the market’s expectations. The central banks, in particular the Bank of England, Norges Bank and the Central Bank of New Zealand, are beginning to worry that inflations is growing out of hand, coupled with a worker shortage across key economic sectors and in light of this have or are about to raise interest rates. Economic data will be closely watched in the days and weeks ahead and the markets are also factoring in a taper in asset purchases programs by the US Fed. As such markets are in a transition period with external and internal market dynamics at play and ultimately plenty of opportunities.
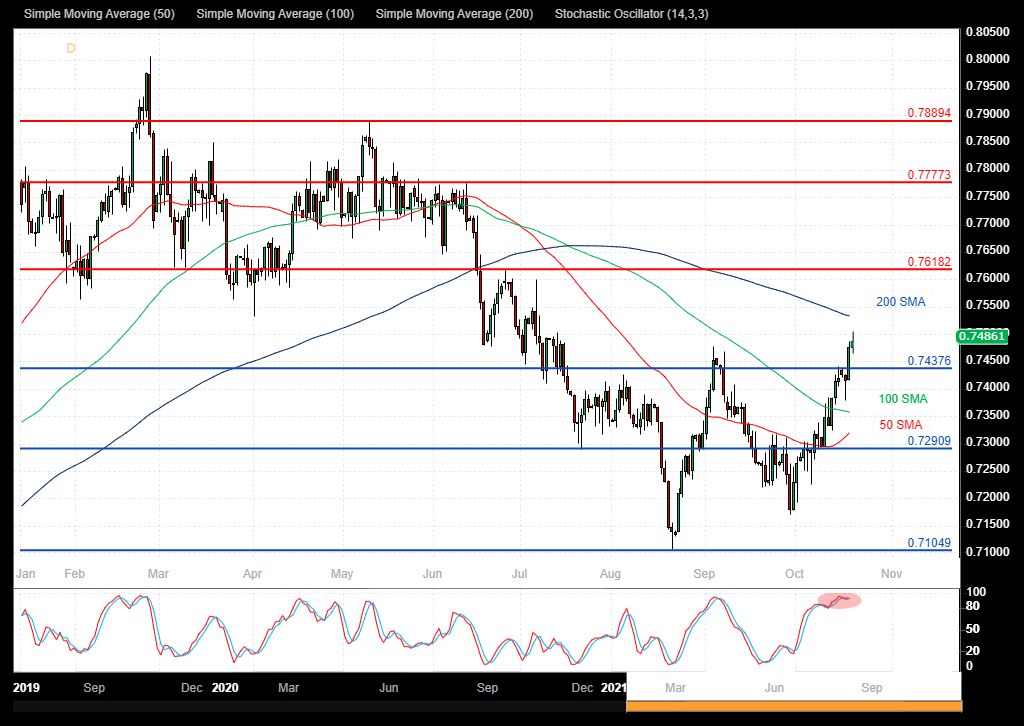
AUDUSD
The AUDUSD FX pair is trading at 0.7497 after breaking above the 0.7475 level as resistance. Price tested resistance at the 0.7500 and rejected lower. The pair is trending higher after its break out around the 50 and 100 SMA but is potentially overstretched as it approaches the 200 SMA at 0.7530 as indicated by the stochastic. A confirmed breakout above this level and the 200 SMA, opens the way to resistance at the 0.7618 area followed by 0.7700 and 0.7777. Alternatively a move down under 0.7437 opens the way to support at 0.7350 and the 100SMA. This area of support is followed by further supports at 0.7300 and 0.7150.
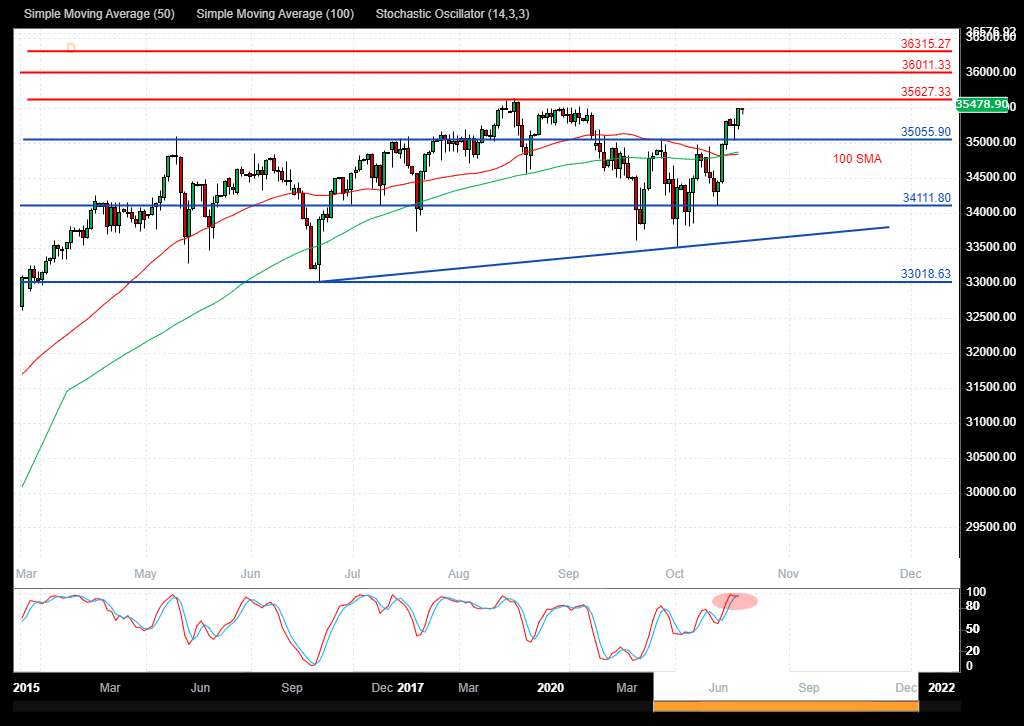
Wall St 30 Index
The Wall St 30 Index has consolidated over recent months and is now testing the resistance area of the last higher high cluster around 35500.00. The stochastic is flashing an overbought warning and the 33500.00 area of support is corresponding to the neckline for a head and shoulders/double top pattern. A selloff below that area would trigger the pattern with a target around 31500.00. The pattern would become invalid with a move back above 35650.00 and a push over 35800.00. If the market breaks above the resistance area at 36000.00, the way opens potential for a rally toward 36300.00. Alternatively, a move back below 35000.00 signals a test on the support at 50 and 100 SMAs around 34850.00 The 34110.00 area then becomes supportive followed by the 34000.00 round number level. Below this level the 33500.00 area would be used as support followed by 33000.00.
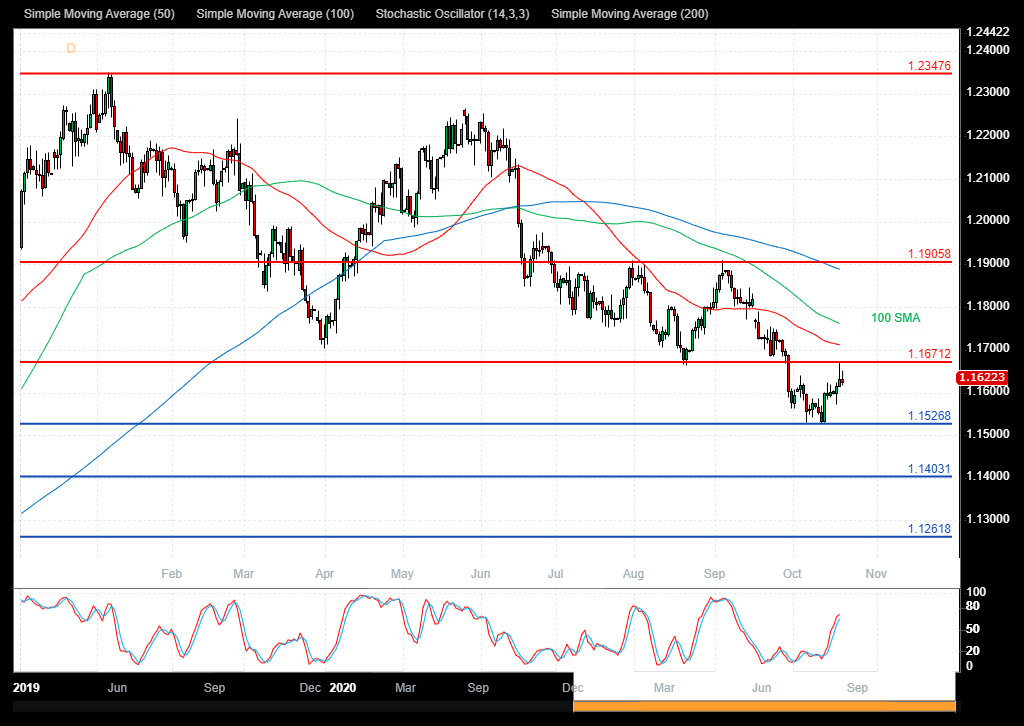
EURUSD
The EURUSD is showing how the price has sold off to test support at 1.1525 to start the month. With price now trading at 1.1640, resistance can be seen at 1.1670 and 50 SMA at 1.1705, while support may be found at 1.1600. The 1.1800 area is expected to act as resistance in the short term, followed by 1.1900 as it relates to the lower high and the 200 SMA. A break above this level would find resistance at the 1.2000 area. A continued move higher finds more resistance around the 1.2265. A breakout from there opens the way to 1.2347. Alternatively a move back down under 1.1600 would find supports at 1.1525 and 1.1500. A loss of this level extends the control of sellers and opens the way to a test on 1.1400 area followed by 1.1300 and 1.1260.