3Sigma Markets – Mid Week Macro Report 15 September 2021
Growing worries surrounding the cash strapped Chinese Evergrande property group is rippling across markets with the groups May 2023 bonds halted for trade after falling more than 20% overnight.
Chinese authorities stated overnight that the group would not be in a position to pay interest due on 20th September. The group has been scrambling to raise the funds it needs to pay suppliers and lenders. Risks are rising of a default linked to the bank such as smaller Chinese financial institutions and the wider Chinese property market. The groups share price fell to a six year low yesterday amid wild swings in price. The group has over $305B in liabilities with no material progress made in its attempt to sell off assets, as fears intensify that it will be unable to repay investors. Markets are riding waves of risk at present as central banks look to taper their Covid emergency purchases programmes. Economic data is presenting mixed signals and Covid is waxing and waning in various locations. All in all the seasonal weakness in asset prices in dragging prices lower as the risk off sentiment takes hold with Quadruple witching taking place in the equity markets later this week – Quadruple witching refers to four days during the calendar year when the contracts on four different kinds of financial assets expire. The assets on which the contracts expire on that day are stock options, single stock futures, stock index futures and stock index options. These expiries days can bring with them added volatility in the stock markets.
The above is all in the backdrop of weaker US stocks markets over the past week. The price action in stocks was very telling yesterday, as they failed to rally on the back of a weaker CPI figure out of the US. In the past this would have been positive for stocks, as with low inflation the global Central Banks are in no rush to taper or raise interest rates and the monetary stimulus continues. Stock markets should be monitored closely over the remaining trading sessions this week, as they dictate the market’s sentiment and moves in other asset classes.
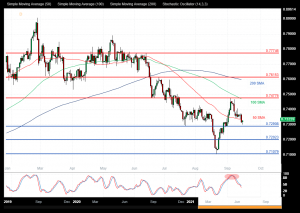
AUDUSD
The AUDUSD FX pair is trading at 0.7325 after testing the 50 SMA as support and breaking lower yesterday to 0.7300. Price tested resistance at the 0.7775 level in July creating a lower area of resistance and then sold off to the 0.7108 support zone in August. The pair is trending higher since then but us running into moving average resistance. Price is using the 0.7477 area as resistance in the short term. A confirmed breakout above this level and the 100 SMA, opens the way to resistance at the 0.7500 area followed by 0.7600. The 0.7615 area may then be resistive followed by the 0.7700 area. Alternatively a move back down under 0.7300 opens the way to support at 0.7200. This area of support is followed by further supports at 0.7130 and 0.7100.
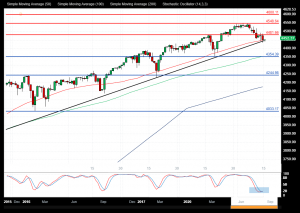
US 500 Index
The US 500 Index created a high at 4549.00 at the start of the month and is now testing the 50 SMA and the rising trend line at 4450.00 area as the price action remains bullish. If the market breaks above the resistance area at 4500.00, the way opens back to 4550.00. Further resistance comes onto the chart at 4573.00 and 4600.00. The market is creating higher highs and higher lows using the support of the trend line. Alternatively, a move back below 4450.00 signals a test on the support at 4430.00 The 4400.00 area then becomes supportive followed by 4354.00 and the 100 SMA. Below this level the 4245.00 area would be used as support along with 4230.00 as a significant higher low.
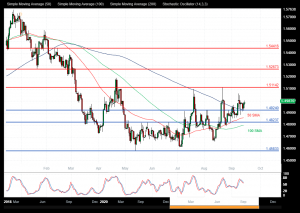
EURCAD
The EURCAD chart is showing how the pair has consolidated over recent weeks after reaching a lower high at 1.5200 in April and finding support at 1.4580 in May. With price now trading at 1.5000 as it consolidates after bouncing from support at 1.4600. The 1.5100 area is expected to act as resistance in the short term. A break above this level would find resistance ahead of 1.5200. A continued move higher finds more resistance around the 1.5267 and 1.5300. A breakout from there opens the way to 1.5442 and 1.5600. Alternatively a move back down under 1.4924 would find supports at 1.4824 and 1.4660 as the August low. A loss of this level extends the control of sellers and opens the way to a test on 1.4600 area.