3Sigma Markets – Mid Week Macro Report 11 August 2021
US Equity Markets continue to inch higher as the core FED members stick to their guns on the transitory nature of inflation and their road map for tapering bond purchases (QE). There have been a number of developments of late – improving US data and the huge employment figure last Friday that may add further pressure on the thesis though. This has also lead to a number of hawks on the Federal Reserve Committee to view their opinions of late and we have seen a considerable rally in US yields on the back of the both of these over the course of the past week – US10 year yields are now up over 20 bps in the past 5 trading sessions. The prospect of tapering is hanging over the market like a guillotine but the rising covid-19 cases in the US may very well delay the start of the taper into next year. The US new daily cases exceeded 160,000 yesterday however the market is remaining calm for the most part. Equity markets are practically pedestrian but commodities are producing volatility with the selloff in Gold around the weekend following the US NFP jobs data release. Oil is also volatile as the market tries to factor in consumption dynamics coupled with tension in the Middle East and ongoing supply bottlenecks. So this brings us to the main risk event of the week and one which could well dictate markets for the rest of the summer and into Sept. The focus for markets today will be on US CPI data (inflation figures) which is expected to decline to 0.5% from the previous months 0.9%. The Core CPI data is forecasted to be 0.4%, last month it was 0.9%. Anything on consensus or above would well provide the momentum for higher US yields and a sustained rallying in the Dollar. This could lead to a further sell off in Gold and may well hit interest rate sensitive markets like the Nasdaq – watch this space……
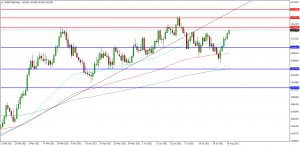
GBPCAD
The GBPCAD FX pair is trading at 1.7330. Price is above its supporting 1.7300 area. Price tested resistance at the 1.7564 level in July creating a new high but then sold off. The pair is consolidating since then. Price is using the 1.7500 area as resistance. A confirmed breakout above 1.7430 may open the way to resistance at the 1.7565 area. The 1.7600 area may provide a target along the way to the 1.7800 area. Alternatively a move back down under 1.7300 and the 1.7250 zone may find initial support at 1.7200. The 1.7145 area may be used as support followed by further supports at 1.7000 and 1.6875.
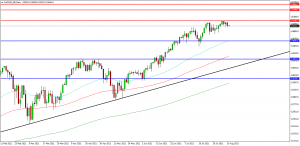
NAS 100 Index
The NAS 100 Index created a new high at 15184.00 on Thursday and is now testing the 15000.00 area as support. If the market breaks above the resistance area, the way opens to 15250.00. The market backed off from the high over the last few days and found support at the 15000.00 area. Price is attempting to build on support in this area followed by the 14800.00/14780.00 area as support. A move higher from the current level may target resistances at the 15200.00 area and 15350.00. Beyond this level, 15500.00 may offer resistance followed by the 15665.00 level. Alternatively, a move back below 14800.00 may signal a test on the support at 14600.00. Below this level the 14400.00 area may be used as support along with the 14250.00 level. A run below this support may quickly target the 14180.00 followed by 14000.00/13950.00.
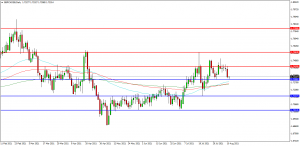
USDJPY
The USDJPY chart is showing how the pair has traded higher over recent days with price now trading at 110.760. The 110.936 level is expected to act as resistance and the 110.580 area is the initial support area. The pair may find resistance at the 111.000 area and the 111.200 level on a break higher. A continued move higher may find more resistance around the 111.500 level followed by the 111.630/111.655 area. Alternatively a move back down under 110.500 may find supports between 110.200 and 110.000. A loss of this level may extend the control of sellers and possibly open the way to a test on 109.675. Below this level the 109.200 area may play its part as support as well as the 109.000 area and 108.300.