3Sigma Markets – Mid Week Macro Report 07th October 2021
The markets have recovered well from their risk off environment that clouded the beginning of the week, as comments from Putin and US Oil Inventory data yesterday helped to calm nerves in the commodity space and a potential compromise on the Debt Ceiling in the US from McConnell – have given stocks a boast. The market as always has one eye on the rally in bond yields – global bond yields – as more and more Central Banks make that hawkish shift in their stance. There are a number of factors affecting the rise in yields such as inflation concerns, supply chain issues and rising commodity prices, alongside of course the US debt limit. Markets are also focussed on the tapering of asset purchase programmes that were launched in response to the Covid-19 outbreak last year and the longer term view on interest rates. The Reserve Bank of New Zealand raised rates to 0.5% from 0.25% on Wednesday as the country grapples with its worse Covid-19 outbreak to date. This was followed by a surprise interest hike by 40 bps by the National Bank of Poland yesterday afternoon – the global interest rate market is shifting and as we have pointed out many times on this report – this has huge implications for all financial asset classes.
Energy prices are continuing to rise and are driving global inflation higher as we head into the winter. This has been extremely evident in the UK of late, who is also being affected by a lack of workers across all sectors of the economy. With the shortfall of workers in the supply chain ahead of the busy Christmas season, the outlook for the UK remains tough and is expected to worsen unless the government take drastic action. However Prime Minister Johnson has denied that Britain is facing an economic crisis and dismissed the shortages as a “predictable consequence of emerging from the coronavirus pandemic” but said it was not his job to fix all the problems businesses face, and said he was not worried about rising energy prices and labour shortages.
We get US monthly employment figures out tomorrow – 1.30pm London time. Non-Farm Payrolls will be the key risk event for the markets this week and should set the tone for the remainder of Oct. Fed Chair Powell has already told the markets that the Fed will be watching tomorrow’s figures closely, however he did caveat this by suggesting that the bar is not high for tomorrow’s figures and therefore a slight miss to expectations should still keep the tapering process on track by the Fed for Nov. A beat tomorrow on the release and we should see US yields climb higher, equities get hit and the Dollar rally.
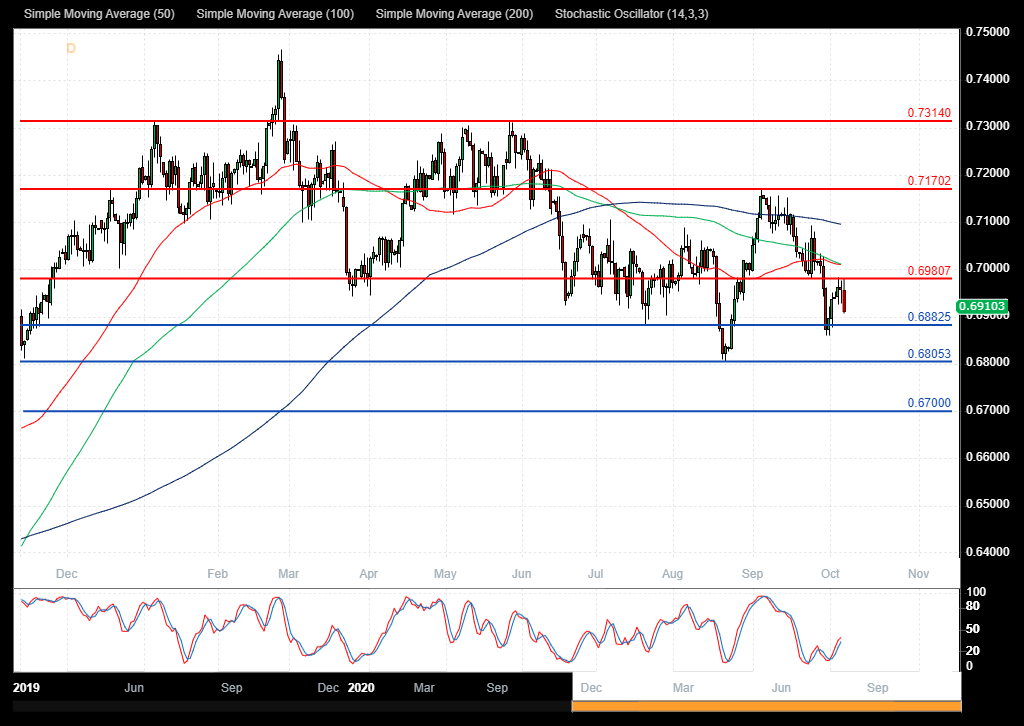
NZDUSD
The NZDUSD FX pair is trading at 0.6908 after breaking below the 0.7000 level as support and testing lower to the 0.6860 area last week. Price tested resistance at the 0.7170 area in September and rejected lower. The pair is pushing lower today after the RBNZ raised interest rates. Price is using the 0.6980 area as resistance in the short term. A confirmed breakout above this level and the 50 SMA, opens the way to resistance at the 0.7100 area and the 200 SMA. Alternatively a move back down under 0.6880 opens the way to support at 0.6800. This area of support is followed by further supports at 0.6700 and 0.6640.
UK 100 Index
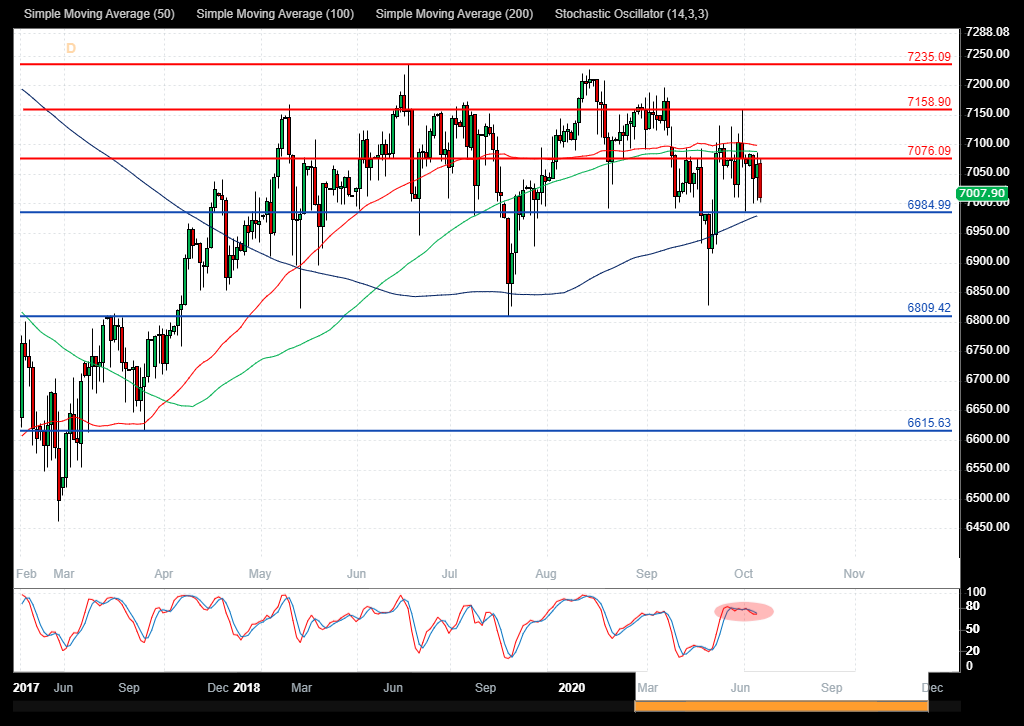
The UK 100 Index has consolidated over recent months and is now testing the support area of the last higher low around 7000.00. The 6800.00 area of support is corresponding to the neckline for a head and shoulders pattern. A selloff below that area would trigger the pattern with a target around 6350.00. The pattern would become invalid with a move back above 7159.00 and a push over 7235.00. If the market breaks above the resistance area at 7076.00, the way opens back to the high at 7157.00. Alternatively, a move back below 6950.00 signals a test on the support at 6900.00 The 6855.00 area then becomes supportive followed by the 6800.00 round number level. Below this level the 6615.00 area would be used as support along with 6470.00 as a significant higher low.
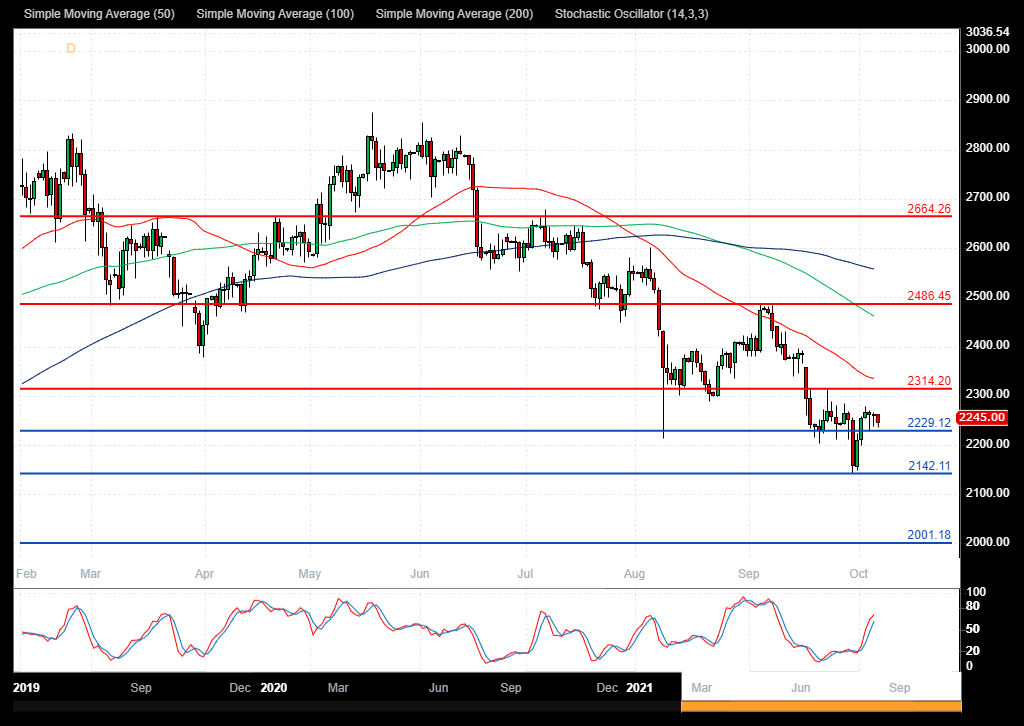
Silver
The Silver chart is showing how the price has sold off to test support at 2142.00. With price now trading at 2230.00, resistance can be seen at 2275.00 and support at 2200.00. The 2314.00 area is expected to act as resistance in the short term as it relates to the lower high. A break above this level would find resistance ahead of 2485.00 lower high. A continued move higher finds more resistance around the 2600.00 and 2660.00. A breakout from there opens the way to 2875.00. Alternatively a move back down under 2200.00 would find supports at 2142.00 and 2100.00. A loss of this level extends the control of sellers and opens the way to a test on 2000.00 area.