3Sigma Markets – Crypto Report June 3rd, 2021
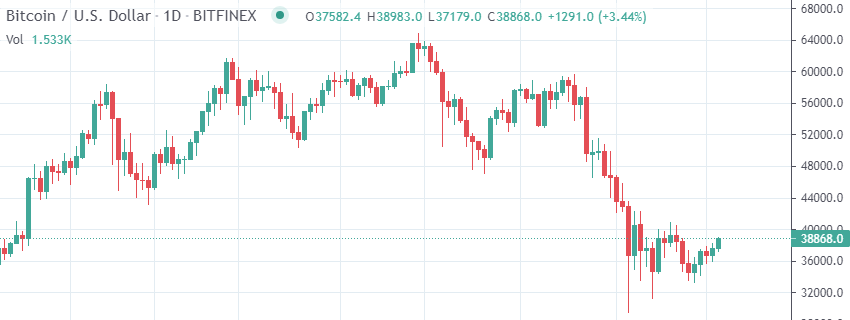
Bitcoin
The selloff from $64,000 fell into the important $30,000 support zone and retraced up to the $42,000 area in May before consolidating below $40,000. Price is currently trading at $38,868 as it attempts to make its way up to $40,000. Support for today comes into focus at $37,200 and buyers should emerge to support price action in that region ahead of $36,000. Support has also been noted around the $33,350 area last week. A loss of the $30,000 level may result in a move down to $27,000 followed by $25,000. Alternatively if buyers can regain $43,000, the path to $45,000 opens up and may lead on to a test on $47,000 as the April low followed by the $50,000 level. A breakout higher may see price consolidate between $50,000 and $60,000 before attempting to break to new highs. The potential trade setup for this market requires a break above $41,850 with targets at $44,000 and $47,500, provided the market can remain above $31,500.
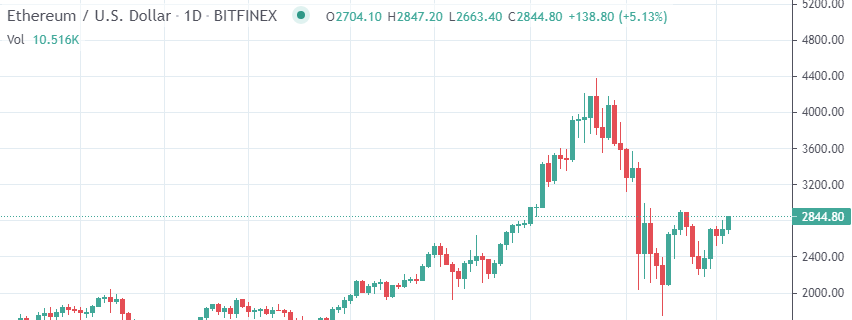
Etherum
Ethereum found support around the 1755.00 area last month and staged a recovery to currently trade around 2844.00. This crypto traded higher to the 2915.00 level last week ahead of resistance at 3000.00. A break above this area targets the former higher low at 3120.00 followed by the 3550.00 area. A break above this zone may open the way to 4000.00 and the high at 4373.00. Alternatively if sellers re-emerge, support may be seen around 2500.00 followed by 2200.00 and 2000.00. The 2178.00 area was used as support and created a higher low last week. A loss of these levels opens the way to a test on the 1920.00 area followed by the higher low at 1550.00. From there the 1300.00 area may be supportive. A potential trade may emerge if the pair can rally above 2850.00 with targets at 3000.00, 3300.00 and 3500.00. However a loss of the 2000.00 area would invalidate this idea.
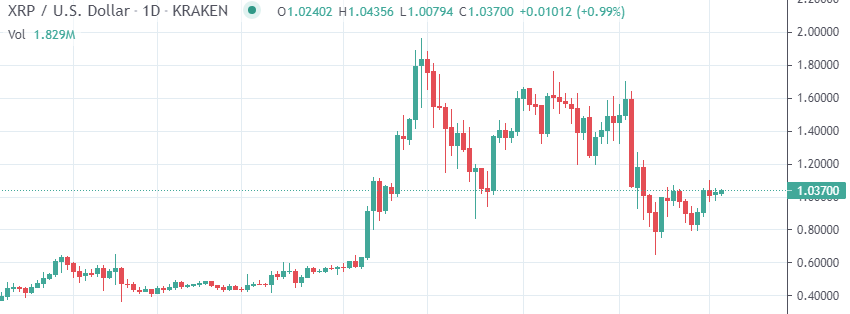
Ripple
The chart is showing that Ripple is consolidating against the USD after it found support at 0.6508, following the selloff last month. The chart suggests that this market is in a consolidation pattern of lower lows and lower highs since mid April potentially forming a bull flag. Price is currently trading around 1.0370. A break above the lower high from last month at 1.7040 may suggest a test on the high from April at 1.9650 may be on the cards. The 2.0000 level may reinforce this as resistance but a push higher might target 2.2000. Alternatively a confirmed loss of the 1.0000 puts pressure on the 0.9000 and may seek to test 0.8680 as the previous higher low. A loss of this level potentially opens the way to 0.7600, 0.7000 and the 0.6500 low. A potential trade may emerge with a move up through 1.0850 looking for a test on potential resistance around 1.1600. Further targets come into focus at 1.2500 and 1.3000. A drop under 0.6000 negates this idea.