3Sigma Markets – Crypto Report June 17th, 2021
Bitcoin
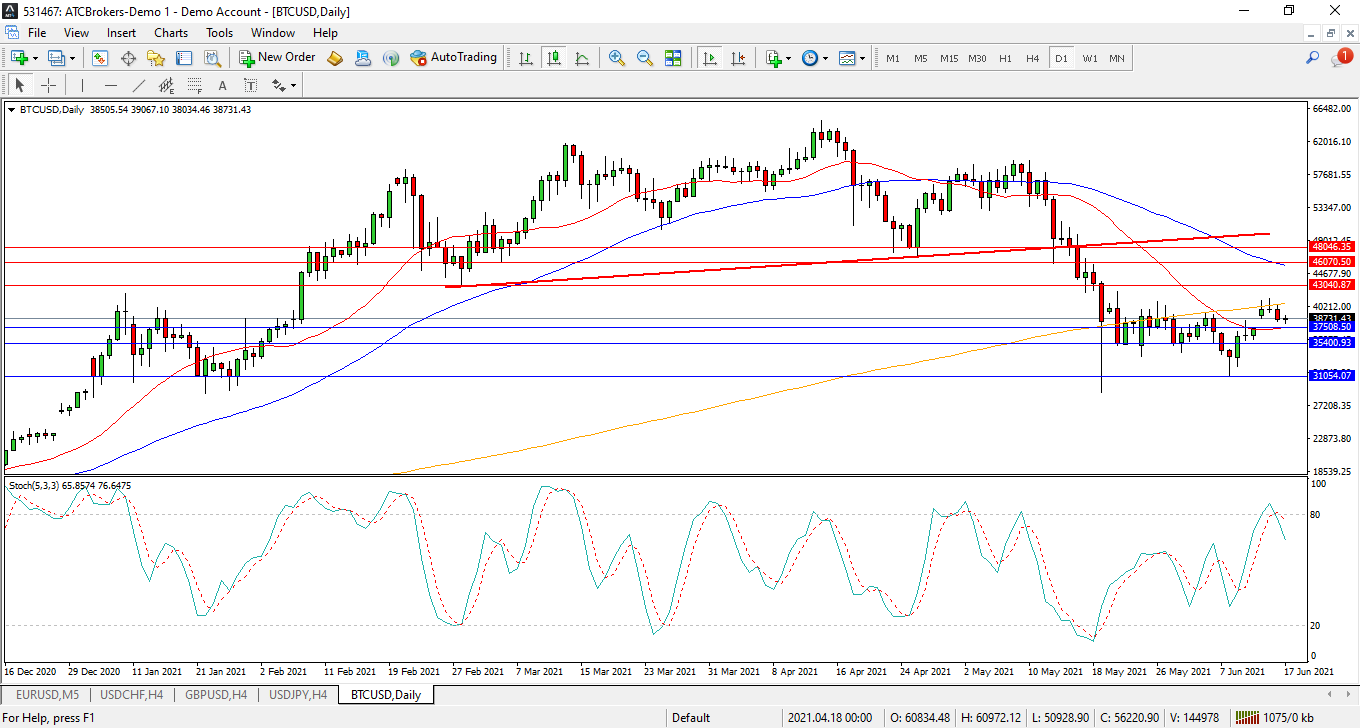
The selloff from 64,000 fell into the important 30,000 support zone and retraced up to the 42,000 area in May before consolidating below 40,000. The 42,000 area was retested as resistance alongside the 200 Day Moving Average and price is currently trading at 38,730 after it rejected this area earlier this week. A confirmed loss of the 50 Day Moving Average at 37,500 may entice sellers to test lower support levels at 35,400 and the higher low at 31,050. The low set during May at 28,850 may then become a target. Alternatively if buyers can regain 43,000, the path to 45,000 opens up and may lead on to a test on 47,000 as the April low and the 46,000/48,000 potential resistance area. A breakout higher may see price consolidate between the 50,000 area and the neckline of the head and shoulders pattern.
Potential Trade Set Up:
The potential trade setup for this market requires a break above 41,850 with targets at 44,000 and 47,500. Alternatively a fall under the 31,000 invalidates this trade as sellers potentially gain more control over direction.
Etherum
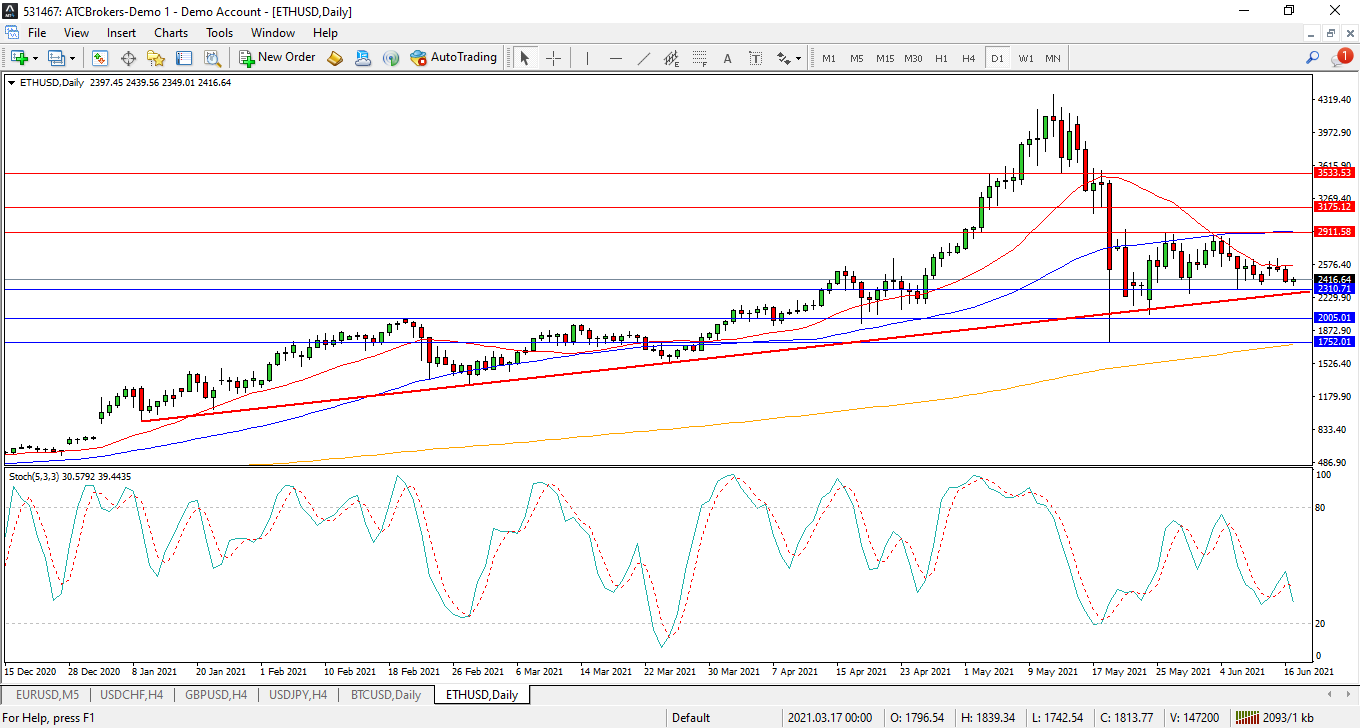
Ethereum found support around the 1750.00 area last month and staged a recovery to test 2911.00 but is currently trading around 2415.00. This crypto traded higher to the 2915.00 level and the resistance at the 20 day and 50 day moving averages. A break above this area targets the former higher low at 3120.00 followed by the 3550.00 area. A break above this zone may open the way to 4000.00 and the high at 4373.00. Alternatively if sellers re-emerge, support may be seen around the rising trend line at 2300.00 followed by the 2000.00 level. A loss of these levels opens the way to a test on the 1920.00 area followed by the higher low at 1750.00.
Potential Trade Set Up:
A potential trade may emerge if the pair can create a bullish rally above 2580.00 with targets at 2900.00, 3300.00 and 3500.00. However a loss of the 2200.00 area would invalidate this idea.
Ripple
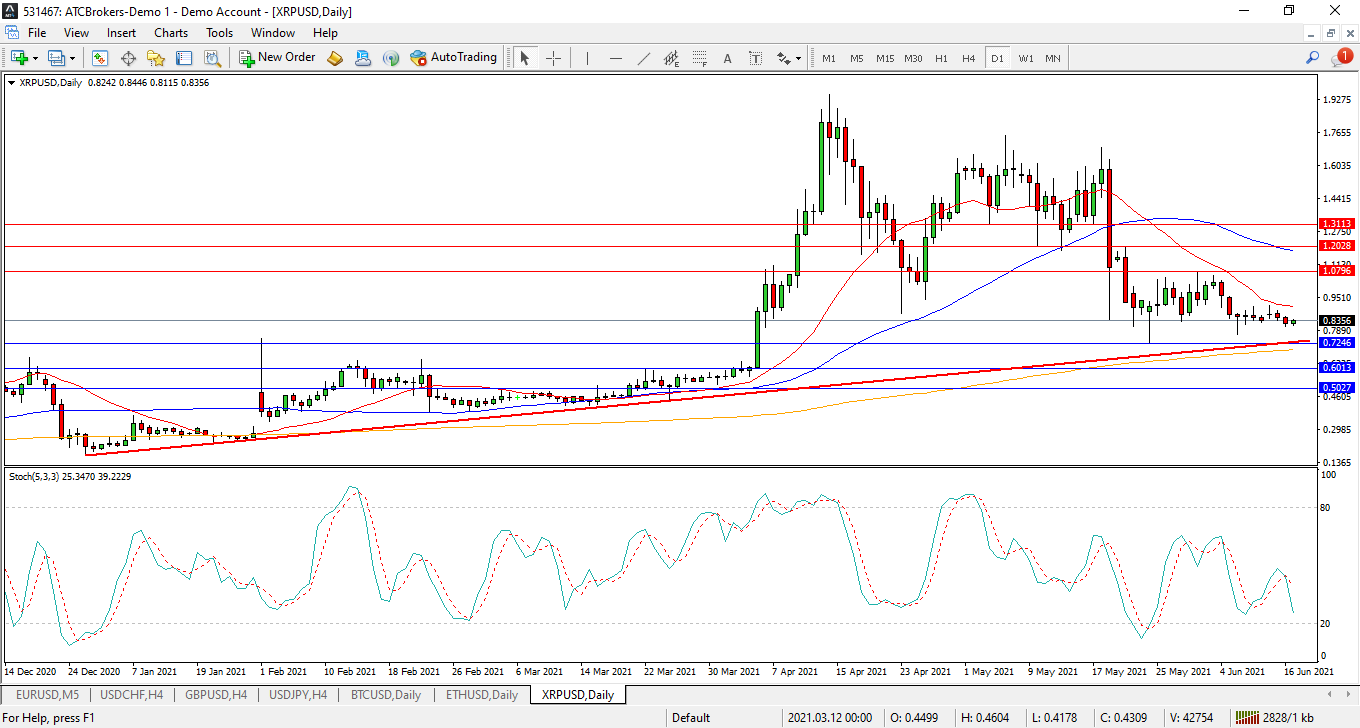
The chart is showing that Ripple is consolidating at 0.9000, following the selloff last month. The chart suggests that this market is in a consolidation pattern of lower lows and lower highs since mid April. Price is currently trading around 0.8355. A break above the 20 day moving average at 0.9074 may suggest a test on the 1.0000 level may be on the cards. This may lead to a push towards the 1.0800 level followed by targets at 1.2000 and 1.3120. Alternatively a confirmed loss of the 0.8000 puts pressure on the trend line at 0.7240 and the 200 day moving average at 0.6940. A loss of this level potentially opens the way to the 0.6000 area.
Potential Trade Set Up:
A potential trade may emerge with a move up through 1.0000 looking for a test on potential the resistance target around 1.1600. Further targets come into focus at 1.2500 and 1.3000. A drop under 0.7800 negates this idea.

