3Sigma Markets – Crypto Report June 10th, 2021
Bitcoin
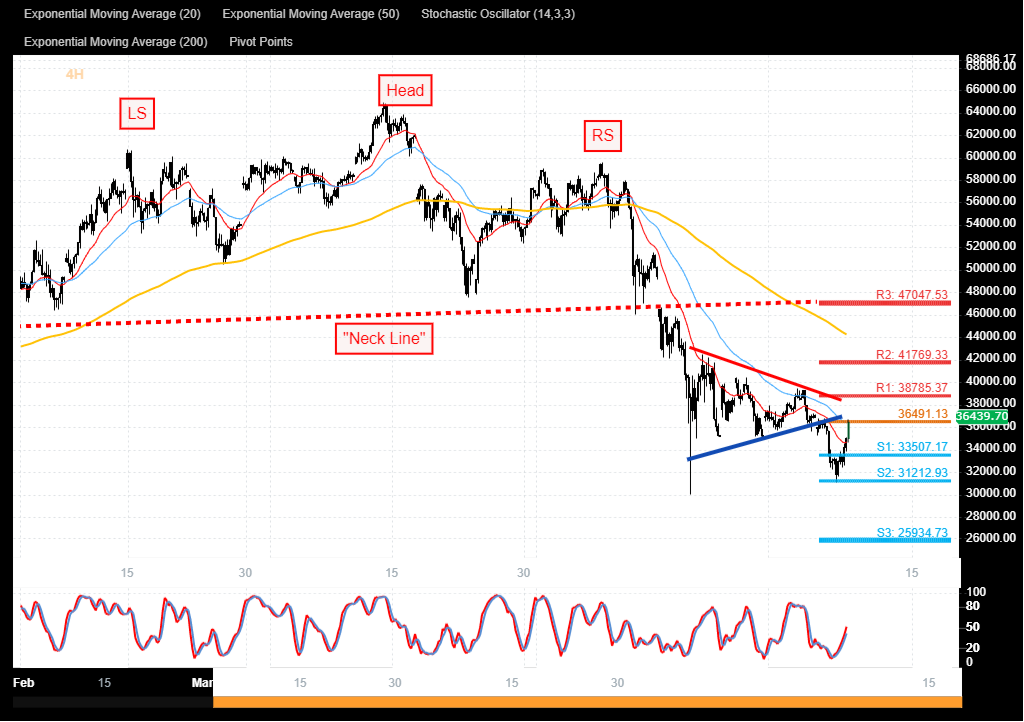
BTC price action appears to be a sideways consolidation, the price is consolidating below 200 period Moving Average. The key trading level is at 41770, the price action appears to be capped by 38785 (03rd June ’21 Swing High) resistance level. A confirmed breakout above 38785 level could appear Bullish targeting additional upside resistances at 40000 followed by 41770 and 44000 – 47050 (Topping Head & Shoulder “Neckline”) levels. Alternatively a confirmed loss of the initial downside support at 33500 level could appear bearish targeting additional supports at 31212 (Swing Low) followed by 30000 – 28670 (22nd Jan 2021 Swing Low) levels.
Possible Trade Set Up: A rally higher from the current Daily Key Trading Level at 38785 level and a confirmed breakout above daily resistance at 40000 could support a Bullish outlook targeting upside resistances at 41770 followed by 44000 and 47050 levels. Alternatively, a confirmed breakout below 31212 level and an End of Day close lower; would invalidate Bullish trade set up.
Etherum
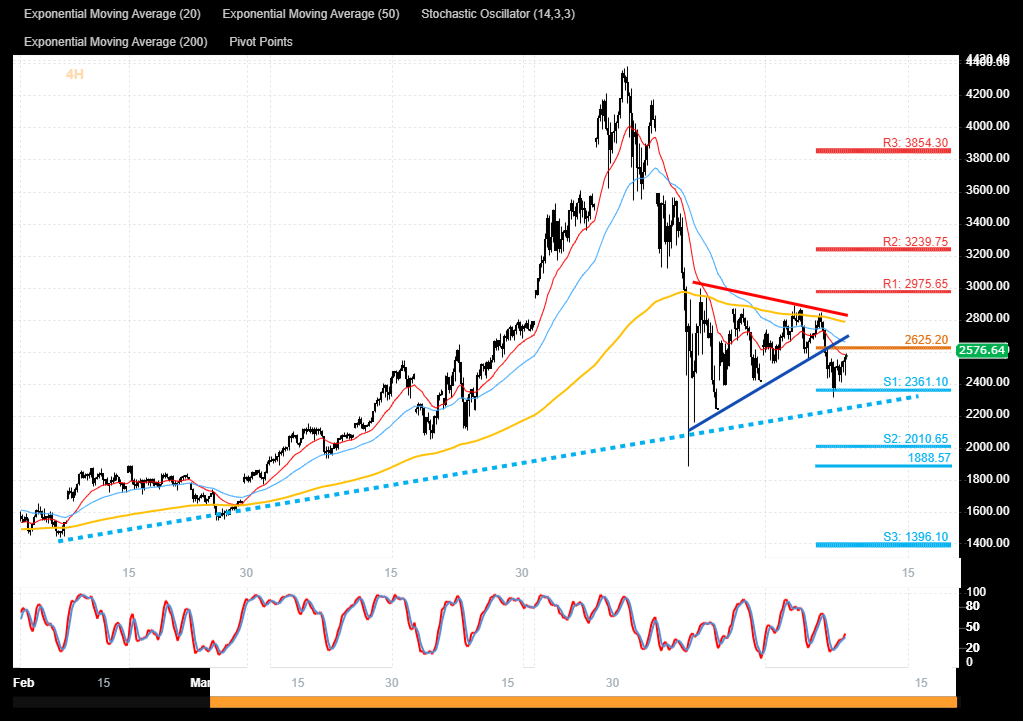
ETH price action appears to be a sideways consolidation. The Key trading level is at 2,625. The upside is capped by initial resistance at 2,800 (200 period Moving Average) level. A confirmed breakout above 2,800 appears Bullish targeting resistances at 2,975-3,000 followed by 3,240 and 3,600 levels. Alternatively a confirmed loss of the initial downside support at 2,361 level could support a Bearish outlook targeting additional downside supports at 2,200 followed by 2,010 and 1,888 levels.
Possible Trade Set Up: A Bullish rally from the current Daily support at 2,625 level and a confirmed breakout above 2,800 resistance level could support a Bullish outlook targeting upside resistances at 3,000 followed by 3,240 and 3,600 levels. Alternatively, a confirmed loss of 2,200 level and an End of Day close below; would invalidate a Bullish trade set up.
Litecoin
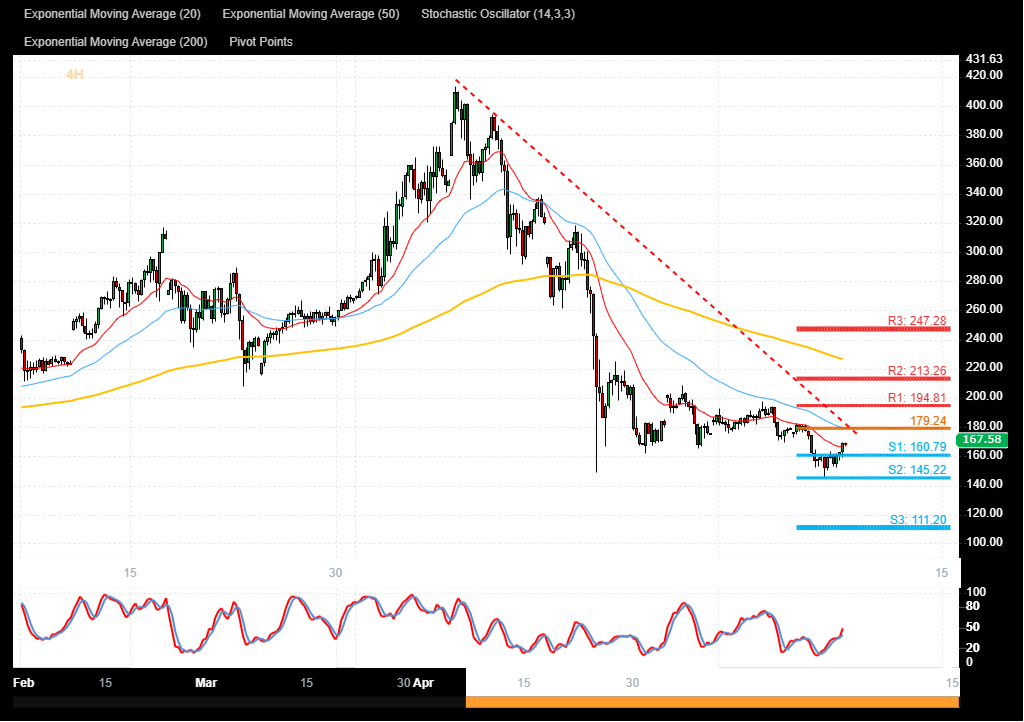
LTC price action appears to be a sideways consolidation, trading below falling resistance trend line. The key trading level is at 179.30 level. The upside is initially capped by 194.80 level. A confirmed breakout above 194.80 could appear Bullish targeting additional upside resistances at 213.20 followed by 247.30 and 260.00 levels. Alternatively, a confirmed loss of the current Daily support at 145.20 (Daily Swing Low) level could support a bearish outlook targeting additional downside supports at 138.20 followed by 117.00 and 100.00 levels.
Possible Trade Set Up: A rally from the key trading level at 179.20 level and a confirmed breakout above current Daily resistance at 194.80, could support a Bullish outlook targeting upside resistances at 213.20 followed by 247.30 and 260.00 levels. Alternatively, a confirmed breakout below 145.20 level and an End of Day close lower; would invalidate a Bullish trade set up.