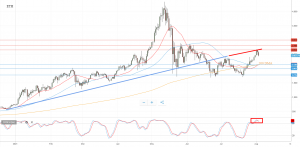
Bitcoin
BTC price action appears to be a bullish breakout, the price is consolidating above rising 20 / 50 Day Moving Averages. The key trading level is at 36200 (Breakout Level), the price action appears to be capped by 41400 (30th July 2021 Swing High) resistance level. A confirmed breakout above 41400 level could appear Bullish targeting additional upside resistances at 44400 (200 Day Moving Average) followed by 47000 and 50000 levels. Alternatively a confirmed loss of the initial downside support at 36200 (Breakout Level) could appear bearish targeting additional supports at 34620 (50 Day Moving Average) followed by 33480 levels.
Possible Trade Set Up:
A rally higher from the current Daily Key Trading Level at 36200 level and a confirmed breakout above daily resistance at 41400 could support a Bullish outlook targeting upside resistances at 44400 followed by 47000 and 50000 levels. Alternatively, a confirmed breakout below 34620 level and an End of Day close lower; would invalidate Bullish trade set up.
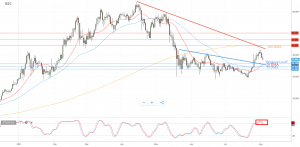
XRP
XRP price action appears to be an oversold bounce back. The key trading level is at 0.7690 (200 Day Moving Average). The upside is capped by the initial resistance at 0.7980 (29th May Swing Low) level. A confirmed breakout above initial resistance at 0.7980 level could appear Bullish targeting additional upside resistances at 0.8720 followed by 0.9180 and 1.0000 (Round Number) levels. Alternatively a confirmed loss of the current support at 0.6560 (50 Day Moving Average) could support a bearish outlook targeting additional downside supports at 0.6030 (20 Day Moving Average) followed by 0.5030 levels.
Possible Trade Set Up:
A rally higher from the key trading level at 0.7690 level and a confirmed breakout above 0.7980 resistance level could support a Bullish outlook targeting upside resistances at 0.8720 followed by 0.9180 and 1.000 levels. Alternatively, a confirmed loss of 0.6030 level and an End of Day close below; would invalidate a Bullish trade set up.
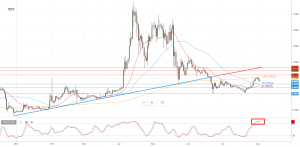
Ethereum
ETH price action appears to be a bullish breakout. The Key trading level is at 2,136 (200 Day Moving Average). The upside is capped by initial resistance at 2,650 (Daily Swing High) level. A confirmed breakout above 2,650 appears Bullish targeting resistances at 2,800 (03rd June Swing High) followed by 3,000 (Round Number) levels. Alternatively a confirmed loss of the initial downside support at 2,136 level could support a Bearish outlook targeting additional downside supports at 2,000 (Round Number) followed by 1,776 (21th July Daily Swing Low) levels.
Possible Trade Set Up:
A Bullish rally from the key trading level at 2,136 level and a confirmed breakout above 2,650 resistance level could support a Bullish outlook targeting upside resistances at 2,800 followed by 3,000 levels. Alternatively, a confirmed loss of 2,000 level and an End of Day close below; would invalidate a Bullish trade set up.