Crypto Report for 3 Sigma Markets 22 July 2021
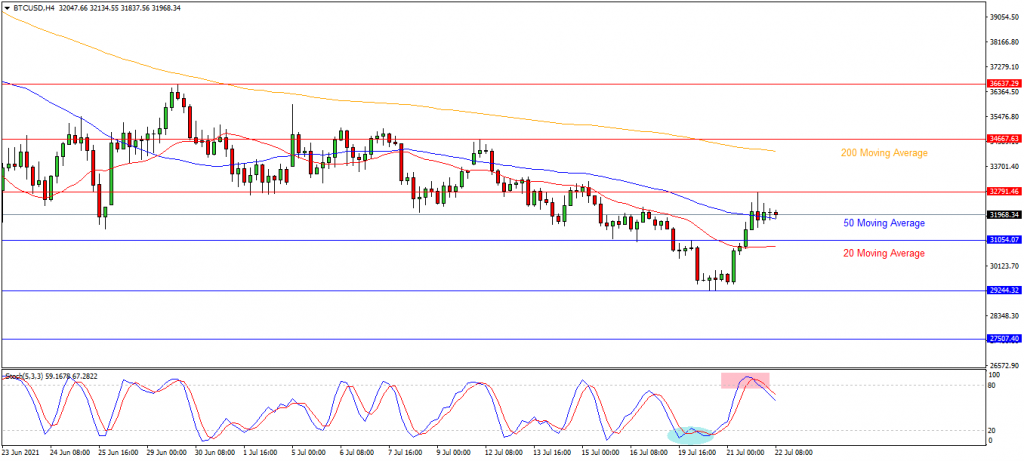
Bitcoin:
The price action in Bitcoin is attempting to move higher this week after a support shattering selloff on Monday. The action has taken price back above its 50 period moving average at 31,800. Price found resistance at 32,800 yesterday and back tested support. The 36,640 area is forming major resistance, capping price and the pair is currently trading at 31,950. The key trading levels for the pair is at 34,250 and the 200 period moving average, as resistance. The upside appears to be capped ahead of 33,300 in the short term. The low set during May at 28,850 has been retested as a key support level and the 29,250 level has formed into support alongside it, with 31,500 as short term support. A loss of this area may open the way to 25,000. Alternatively if buyers can regain 35,000, the path to 38,000 opens up and may lead on to a test on 40,000 as a potential resistance area.
Potential Trade Set Up:
The potential trade setup for this market requires a break above 32,800 with targets at 34,000 and 36,600. Alternatively a move under the 31,050 invalidates this trade as sellers attempt a break lower.
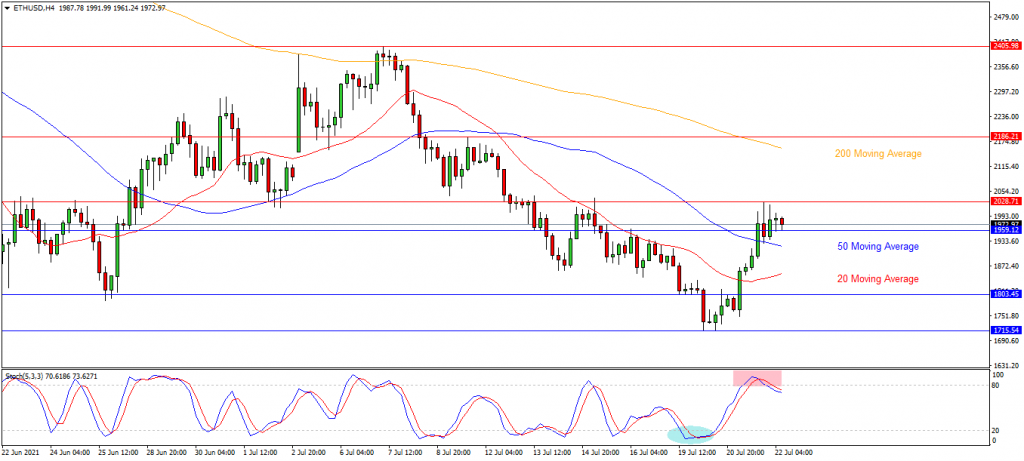
 Ethereum:
Ethereum found support around the 1690.00 area last month and staged a recovery to test 2400.00 but is currently trading around 1960.00. This market is consolidating and effectively range bound. The upside is currently capped by 2400.00. A break above the key 2050.00 area may target the 2160.00 area followed by the 2300.00 area. A break above this zone may open the way to 2500.00. Downside is initially supported by 1930.00 and the lows around 1800.00, 1715.00 and 1690.00. Alternatively if sellers break these supports the 1500.00 level becomes a target. A loss of these levels opens the way to a test on the 1450.00 area followed by the higher low at 1320.00.
Potential Trade Set Up:
A potential trade may emerge if the pair can create a bullish rally above 2028.00 using the 50 period moving average as support, with targets at 2150.00, 2280.00 and 2400.00. However a loss of the 1900.00 area would invalidate this idea.
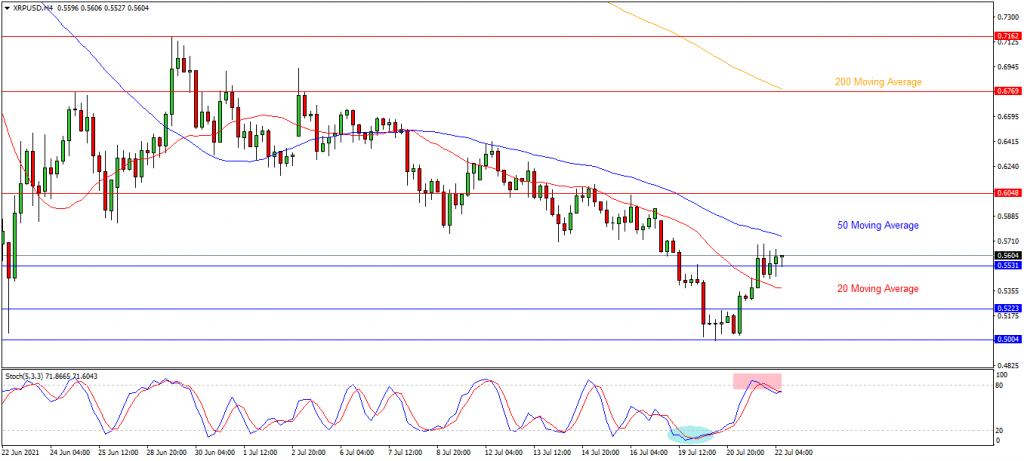
Ripple:
The chart is showing that Ripple is trending lower within a larger consolidation between 0.7160 and 0.5000. Price is currently trading at 0.5604 and is testing the key support level at 0.5530. A break down from there may result in at test on initial support at the 20 period moving average, around 0.5380 followed by the low at 0.5004. Alternatively a confirmed break above the initial resistance at the 50 period moving average at 0.5743, may signal a test on 0.6050 followed by 0.6770 and potentially higher. A breakout of this level potentially opens the way to the lower high at the 0.7160 area.
Potential Trade Set Up:
A potential trade may emerge with a move up through 0.5800 looking for a test on potential the resistance targets around 0.6000 and 0.6800 followed by 0.7160. A drop under 0.5200 negates this idea.