Crypto Report for 3 Sigma Markets 15 July 2021
Bitcoin:
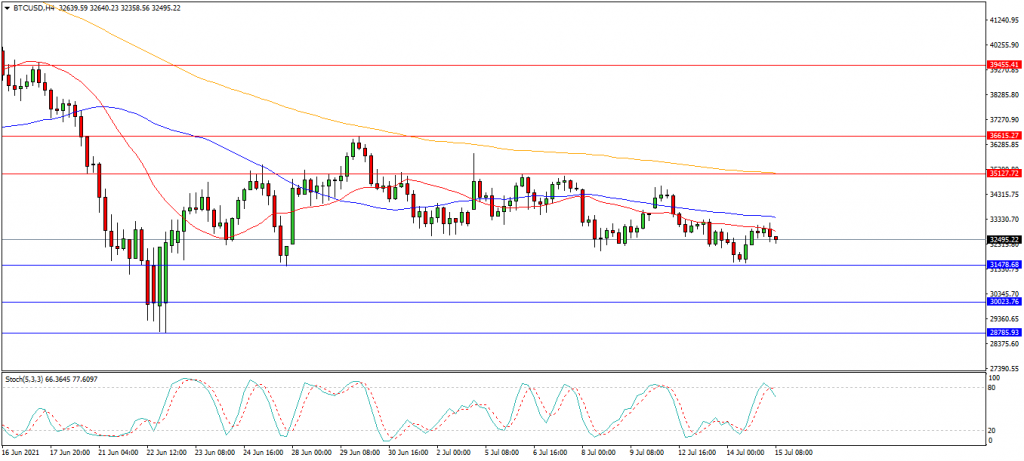
The price action in Bitcoin is consolidating with a downward bias making new lower highs as indicated by the sideways moving averages and narrowing ranges. The 35,860 to 37,000 area is forming major resistance, capping price and the pair is currently trading at 32,500. The key trading levels for the pair is at 35,130 and the 200 period moving average, which is being used as resistance. The upside appears to be capped around 33,300 in the short term. The low set during May at 28,850 has been retested as a key support level and the 28,785 level has formed into support alongside it, with 31,500 as short term support. A loss of this area may open the way to 25,000. Alternatively if buyers can regain 35,000, the path to 38,000 opens up and may lead on to a test on 40,000 as a potential resistance area.
Potential Trade Set Up:
The potential trade setup for this market requires a break above 33,300 with targets at 35,000 and 39,500. Alternatively a move under the 31,000 invalidates this trade as sellers attempt a break lower.
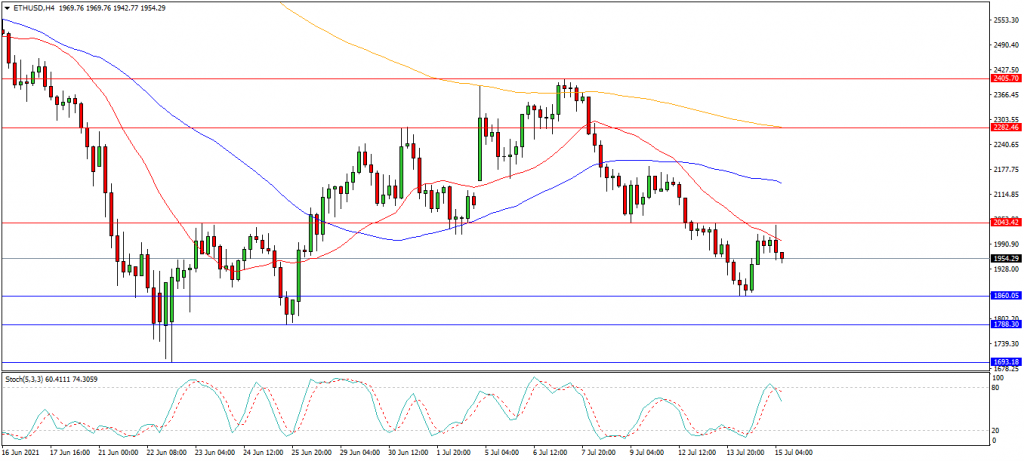
Ethereum:
Ethereum found support around the 1690.00 area last month and staged a recovery to test 2400.00 but is currently trading around 1955.00. This market is consolidating and forming higher lows and higher highs off its late June low. The upside is currently capped by 2400.00. A break above the key 2400.00 area may target the 2530.00 area followed by the 2600.00 area. A break above this zone may open the way to 3000.00. Downside is initially supported by 1860.00 and the lows at 1788.00 and 1690.00. Alternatively if sellers break these supports the 1500.00 level becomes a target. A loss of these levels opens the way to a test on the 1450.00 area followed by the higher low at 1320.00.
Potential Trade Set Up:
A potential trade may emerge if the pair can create a bullish rally above 2045.00 and a break above the 50 period moving average, with targets at 2140.00, 2280.00 and 2405.00. However a loss of the 1860.00 area would invalidate this idea.
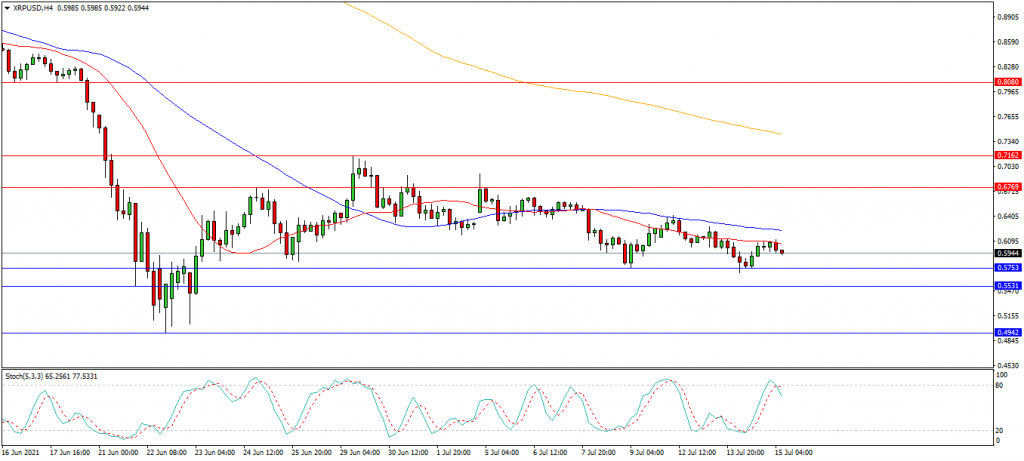
Ripple:
The chart is showing that Ripple is consolidating across 0.6525, creating lower highs and higher lows. Price is currently trading at 0.5944 and is testing the key support level at 0.6000. A break down from there may result in at test on initial support at 0.5530 followed by the low at 0.4940 as the late June low. Alternatively a confirmed break above the initial resistance at the 50 and 100 period moving averages at 0.6059 and 0.6225 may signal a test on 0.6770 and potentially higher. A breakout of this level potentially opens the way to the lower high at the 0.7160 area.
Potential Trade Set Up:
A potential trade may emerge with a move up through 0.6250 looking for a test on potential the resistance targets around 0.6800 and 0.7100 followed by 0.800. A drop under 0.5500 negates this idea. The price action suggests that a bottom may be forming despite overbought readings on the stochastic. A break higher would potentially set up a short squeeze scenario and FOMO trade.