BTC, XRP, ETH Outlook Report 10th Aug 2021
Bitcoin
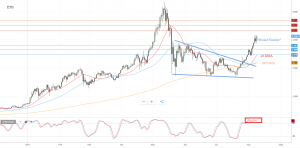
BTC price action appears to be a bullish breakout, the price is above psychologically important 200 Day Moving Average. The key trading level is at 44755 (200 Day Moving Average), the price action appears to be capped by 47970 (26th April 2021 Swing Low) resistance level. A confirmed breakout above 47970 level could appear Bullish targeting additional upside resistances at 50000 (Round Number) followed by 51820 and 52680 levels. Alternatively a confirmed loss of the initial downside support at 41480 (Breakout Level) could appear bearish targeting additional supports at 40000 followed by 38750 (20 Day Moving Average) followed by 35333 (50 Day Moving Average) levels.
Possible Trade Set Up: A rally higher from the current Daily Key Trading Level at 44755 level and a confirmed breakout above daily resistance at 47970 could support a Bullish outlook targeting upside resistances at 50000 followed by 51820 and 52680 levels. Alternatively, a confirmed breakout below 41480 level and an End of Day close lower; would invalidate Bullish trade set up.
XRP
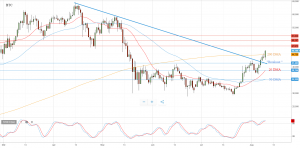
XRP price action appears to be an oversold bounce back. The key trading level is at 0.7840 (200 Day Moving Average). The upside is capped by the initial resistance at 0.8730 (14th June Swing High) level. A confirmed breakout above initial resistance at 0.8730 level could appear Bullish targeting additional upside resistances at 0.9120 followed by 1.0000 (Round Number) levels. Alternatively a confirmed loss of the current support at 0.6900 (20 Day Moving Average) could support a bearish outlook targeting additional downside supports at 0.6490 (50 Day Moving Average) followed by 0.5830 and 0.5000 levels.
Possible Trade Set Up: A rally higher from the key trading level at 0.7840 level and a confirmed breakout above 0.8720 resistance level could support a Bullish outlook targeting upside resistances at 0.9180 followed by 1.000 levels. Alternatively, a confirmed loss of 0.6900 level and an End of Day close below; would invalidate a Bullish trade set up.
Ethereum
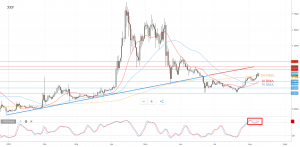
ETH price action appears to be a bullish breakout. The Key trading level is at 3,000 (Round Number). The upside is capped by initial resistance at 3,337 (16th May Swing Low) level. A confirmed breakout above 3,337 appears Bullish targeting resistances at 3,520 (13th May Swing Low) followed by 3,690 levels. Alternatively a confirmed loss of the initial downside support at 2,797 level could support a Bearish outlook targeting additional downside supports at 2,650 (01st Aug Daily Swing High) followed by 2,470 (20 Day Moving Average) levels.
Possible Trade Set Up: A Bullish rally from the key trading level at 3,000 level and a confirmed breakout above 3,337 resistance level could support a Bullish outlook targeting upside resistances at 3,520 followed by 3,690 levels. Alternatively, a confirmed loss of 2,797 level and an End of Day close below; would invalidate a Bullish trade set up.