3SigmaMarkets BTC, XRP, ETH Outlook Report 01st Sep 2021
Bitcoin
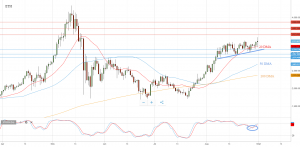
BTC price action appears to be a sideways consolidation, the price is above the psychologically important 200 Day Moving Average. The key trading level is at 45850 (200 Day Moving Average), the price action appears to be capped by a 50000 (Round Number) resistance level. A confirmed breakout above 51820 (26th March 2021 Swing Low) level could appear Bullish targeting additional upside resistances at 54555 followed by 58845 and 60000 levels. Alternatively, a confirmed loss of the initial downside support at 45850 (200 Day Moving Average) could appear bearish targeting additional supports at 43730 followed by 41280 (50 Day Moving Average) and 40000 levels.
Possible Trade Set Up: A rally higher from the current Daily Key Trading Level at 45850 level and a confirmed breakout above daily resistance at 50000 followed by 51820 level, could support a Bullish outlook targeting upside resistances at 54555 followed by 58845 and 60000 levels. Alternatively, a confirmed breakout below 43730 level and an End of Day close lower; would invalidate the Bullish trade set up.
XRP
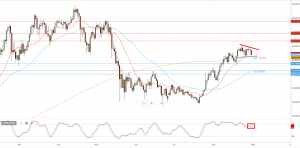
XRP price action appears to be a sideways consolidation. The key trading level is at 1.0400 (27th Aug Daily Swing Low). The upside is capped by the initial resistance at 1.2500 level. A confirmed breakout above initial resistance at 1.2500 level could appear Bullish targeting additional upside resistances at 1.3500 followed by 1.4475 and 1.5770 levels. Alternatively a confirmed loss of the current support at 1.0400 level, could support a bearish outlook targeting additional downside supports at 1.0000 (Round Number) followed by 0.9560 and 0.8660 (200 Day Moving Average) levels.
Possible Trade Set Up: A rally higher from the key trading level at 1.0400 level and a confirmed breakout above 1.2500 resistance level could support a Bullish outlook targeting upside resistances at 1.3500 followed by 1.4475 and 1.5770 levels. Alternatively, a confirmed loss of 0.9560 level and an End of Day close below; would invalidate a Bullish trade set up.
Ethereum
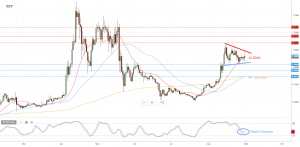
ETH price action appears to be a bullish breakout. The Key trading level is at 3,180 (20 Day Moving Average). The upside is capped by initial resistance at 3,411 (19th May Swing High) level. A confirmed breakout above 3,411 appears Bullish targeting resistances at 3,520 (13th May Swing Low) followed by 3,690 and 3870 levels. Alternatively a confirmed loss of the initial downside support at 3,180 level could support a Bearish outlook targeting additional downside supports at 3,100 followed by 2,970 and 2,870 levels.
Possible Trade Set Up: A Bullish rally from the key trading level at 3,180 level and a confirmed breakout above 3,411 resistance level could support a Bullish outlook targeting upside resistances at 3,520 followed by 3,690 – 3,869 levels. Alternatively, a confirmed loss of 3,100 level and an End of Day close below; would invalidate a Bullish trade set up.