3SigmaMarkets BTC, XRP, ETH Outlook Report 21st Sep 2021
Bitcoin
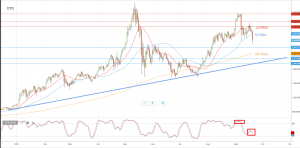
BTC price action appears to be a corrective pullback potentially forming a topping Head & Shoulder price pattern. The price is trading below 20/50 and 200 Day Moving Averages. The key trading level is at 45600 (200 Day Moving Average), the price action appears to be capped by 47260 (20 Day Moving Average) resistance level. A confirmed breakout above 47260 level could appear Bullish targeting additional upside resistances at 50000 followed by 51795 and 53550 levels. Alternatively a confirmed loss of the initial downside support at 41446 901s Aug 2021 Swing High) could appear bearish targeting additional supports at 40000 followed by 37900 and 36000 levels.
Possible Trade Set Up: A rally higher from the current Daily Key Trading Level at 45600 level and a confirmed breakout above daily resistance at 47260, could support a Bullish outlook targeting upside resistances at 50000 followed by 51795 and 53550 levels. Alternatively, a confirmed breakout below 40000 level and an End of Day close lower; would invalidate Bullish trade set up.
XRP
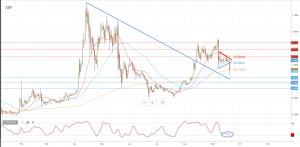
XRP price action appears to be a corrective pullback. The key trading level is at 0.9280 (200 Day Moving Average). The upside is capped by the initial resistance at 1.0640 (50 Day Moving Average) level. A confirmed breakout above initial resistance at 1.0640 level could appear Bullish targeting additional upside resistances at 1.1190 (20 Day Moving Average) followed by 1.2275 and 1.3330 levels. Alternatively a confirmed loss of the current support at 0.8050 level, could support a bearish outlook targeting additional downside supports at 0.7285 followed by 0.6470 levels.
Possible Trade Set Up: A rally higher from the key trading level at 0.9280 level and a confirmed breakout above 1.0645 resistance level could support a Bullish outlook targeting upside resistances at 1.1190 followed by 1.2275 and 1.3334 levels. Alternatively, a confirmed loss of 0.8050 level and an End of Day close below; would invalidate a Bullish trade set up.
Ethereum
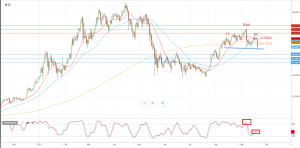
ETH price action appears to be a corrective pullback. The Key trading level is at 3,240 (50 Day Moving Average). The upside is capped by initial resistance at 3,480 (20 Day Moving Average) level. A confirmed breakout above 3,480 appears Bullish targeting resistances at 3,680 followed by 3,942 and 4,100 levels. Alternatively a confirmed loss of the initial downside support at 2,770 level could support a Bearish outlook targeting additional downside supports at 2,550 (200 Day Moving Average) followed by 2,380 and 2,200 levels.
Possible Trade Set Up: A Bullish rally from the key trading level at 3,240 level and a confirmed breakout above 3,480 resistance level could support a Bullish outlook targeting upside resistances at 3,680 followed by 3,940 and 4,100 levels. Alternatively, a confirmed loss of 2,550 level and an End of Day close below; would invalidate a Bullish trade set up.